Estonian vs Creek Median Household Income
COMPARE
Estonian
Creek
Median Household Income
Median Household Income Comparison
Estonians
Creek
$95,930
MEDIAN HOUSEHOLD INCOME
99.9/ 100
METRIC RATING
51st/ 347
METRIC RANK
$67,715
MEDIAN HOUSEHOLD INCOME
0.0/ 100
METRIC RATING
333rd/ 347
METRIC RANK
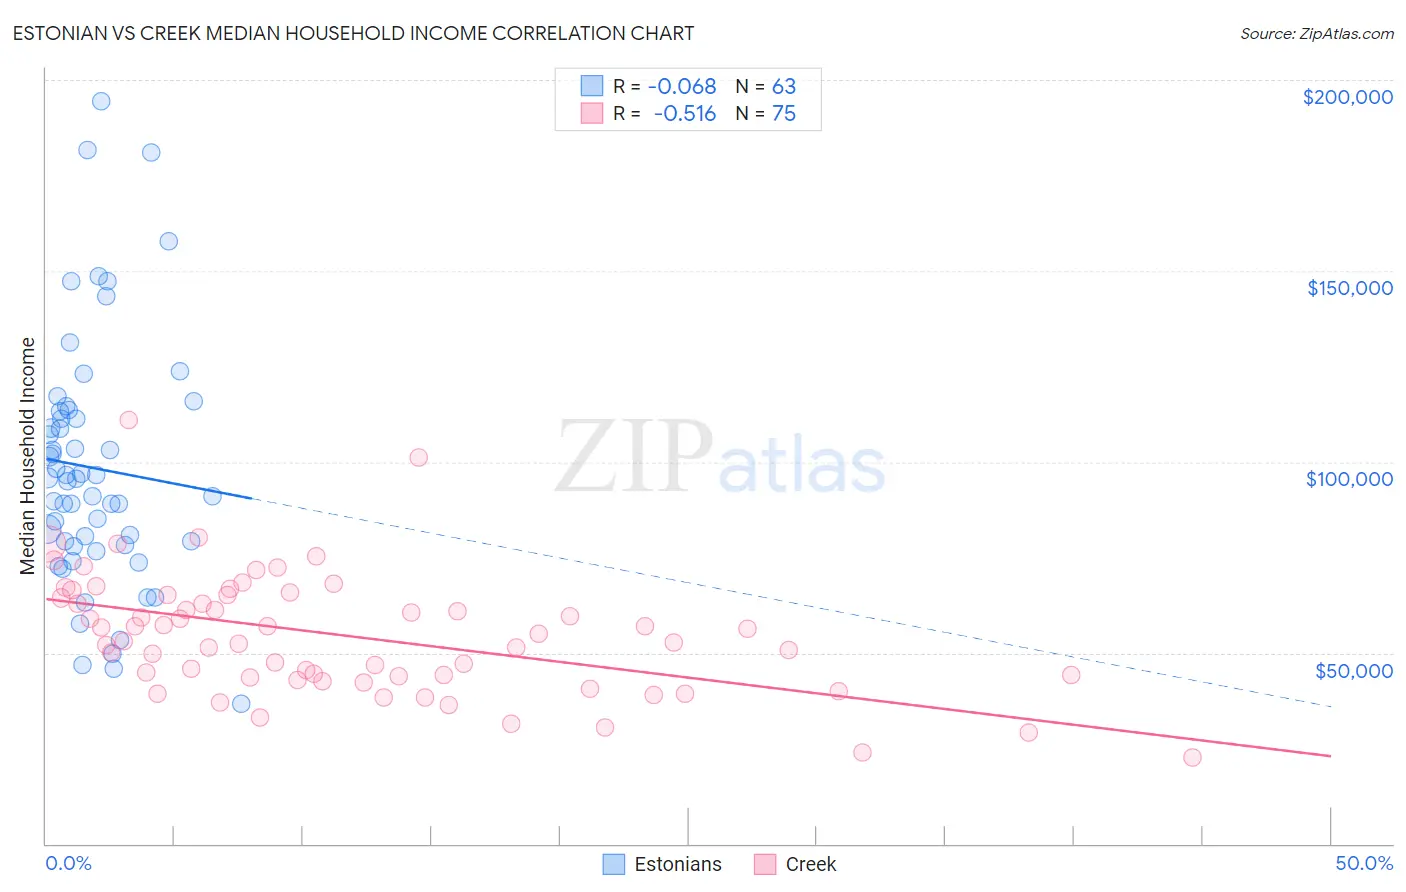
Estonian vs Creek Median Household Income Correlation Chart
The statistical analysis conducted on geographies consisting of 123,471,102 people shows a slight negative correlation between the proportion of Estonians and median household income in the United States with a correlation coefficient (R) of -0.068 and weighted average of $95,930. Similarly, the statistical analysis conducted on geographies consisting of 178,405,677 people shows a substantial negative correlation between the proportion of Creek and median household income in the United States with a correlation coefficient (R) of -0.516 and weighted average of $67,715, a difference of 41.7%.
Median Household Income Correlation Summary
| Measurement | Estonian | Creek |
| Minimum | $36,563 | $22,500 |
| Maximum | $194,375 | $111,063 |
| Range | $157,812 | $88,563 |
| Mean | $98,343 | $54,543 |
| Median | $95,522 | $53,166 |
| Interquartile 25% (IQ1) | $78,091 | $43,621 |
| Interquartile 75% (IQ3) | $113,403 | $65,130 |
| Interquartile Range (IQR) | $35,312 | $21,509 |
| Standard Deviation (Sample) | $32,504 | $15,915 |
| Standard Deviation (Population) | $32,245 | $15,809 |
Similar Demographics by Median Household Income
Demographics Similar to Estonians by Median Household Income
In terms of median household income, the demographic groups most similar to Estonians are Immigrants from South Africa ($95,800, a difference of 0.14%), Paraguayan ($95,737, a difference of 0.20%), Egyptian ($95,673, a difference of 0.27%), Immigrants from Malaysia ($96,292, a difference of 0.38%), and Bulgarian ($96,290, a difference of 0.38%).
| Demographics | Rating | Rank | Median Household Income |
| Immigrants | Greece | 99.9 /100 | #44 | Exceptional $96,675 |
| Israelis | 99.9 /100 | #45 | Exceptional $96,552 |
| Australians | 99.9 /100 | #46 | Exceptional $96,490 |
| Immigrants | Russia | 99.9 /100 | #47 | Exceptional $96,378 |
| Cambodians | 99.9 /100 | #48 | Exceptional $96,324 |
| Immigrants | Malaysia | 99.9 /100 | #49 | Exceptional $96,292 |
| Bulgarians | 99.9 /100 | #50 | Exceptional $96,290 |
| Estonians | 99.9 /100 | #51 | Exceptional $95,930 |
| Immigrants | South Africa | 99.9 /100 | #52 | Exceptional $95,800 |
| Paraguayans | 99.9 /100 | #53 | Exceptional $95,737 |
| Egyptians | 99.9 /100 | #54 | Exceptional $95,673 |
| Immigrants | Czechoslovakia | 99.9 /100 | #55 | Exceptional $95,319 |
| Immigrants | Austria | 99.9 /100 | #56 | Exceptional $95,277 |
| New Zealanders | 99.8 /100 | #57 | Exceptional $95,146 |
| Soviet Union | 99.8 /100 | #58 | Exceptional $95,098 |
Demographics Similar to Creek by Median Household Income
In terms of median household income, the demographic groups most similar to Creek are Sioux ($67,792, a difference of 0.11%), Black/African American ($67,573, a difference of 0.21%), Native/Alaskan ($67,879, a difference of 0.24%), Arapaho ($67,965, a difference of 0.37%), and Dutch West Indian ($68,412, a difference of 1.0%).
| Demographics | Rating | Rank | Median Household Income |
| Yuman | 0.0 /100 | #326 | Tragic $68,743 |
| Immigrants | Cuba | 0.0 /100 | #327 | Tragic $68,461 |
| Menominee | 0.0 /100 | #328 | Tragic $68,423 |
| Dutch West Indians | 0.0 /100 | #329 | Tragic $68,412 |
| Arapaho | 0.0 /100 | #330 | Tragic $67,965 |
| Natives/Alaskans | 0.0 /100 | #331 | Tragic $67,879 |
| Sioux | 0.0 /100 | #332 | Tragic $67,792 |
| Creek | 0.0 /100 | #333 | Tragic $67,715 |
| Blacks/African Americans | 0.0 /100 | #334 | Tragic $67,573 |
| Cheyenne | 0.0 /100 | #335 | Tragic $66,974 |
| Immigrants | Congo | 0.0 /100 | #336 | Tragic $66,768 |
| Kiowa | 0.0 /100 | #337 | Tragic $65,914 |
| Immigrants | Yemen | 0.0 /100 | #338 | Tragic $65,194 |
| Hopi | 0.0 /100 | #339 | Tragic $65,043 |
| Pueblo | 0.0 /100 | #340 | Tragic $64,692 |