Dutch vs Tlingit-Haida 4 or more Vehicles in Household
COMPARE
Dutch
Tlingit-Haida
4 or more Vehicles in Household
4 or more Vehicles in Household Comparison
Dutch
Tlingit-Haida
7.7%
4 OR MORE VEHICLES IN HOUSEHOLD
100.0/ 100
METRIC RATING
54th/ 347
METRIC RANK
6.8%
4 OR MORE VEHICLES IN HOUSEHOLD
96.2/ 100
METRIC RATING
115th/ 347
METRIC RANK
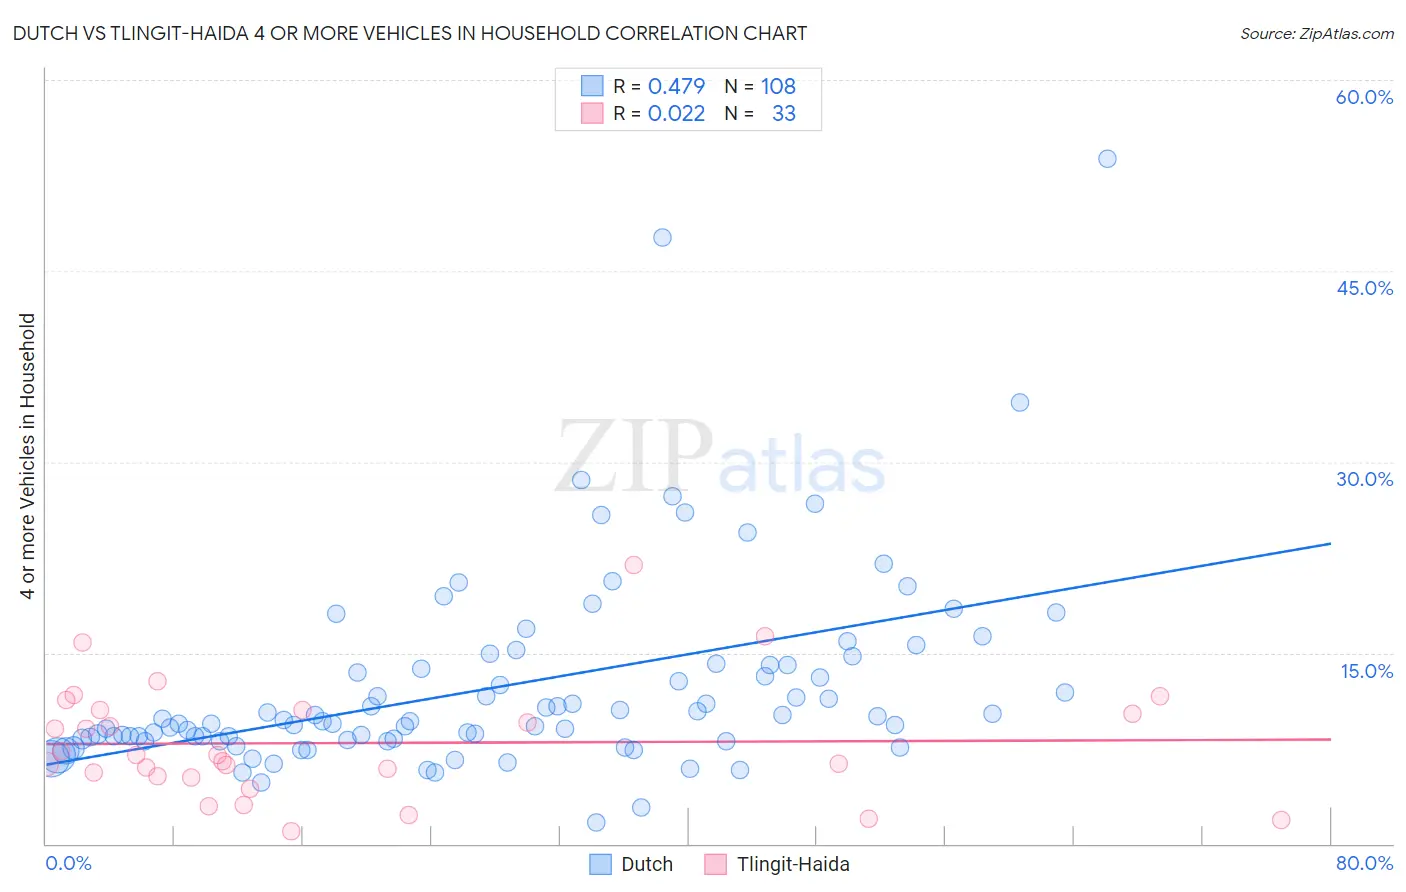
Dutch vs Tlingit-Haida 4 or more Vehicles in Household Correlation Chart
The statistical analysis conducted on geographies consisting of 551,480,687 people shows a moderate positive correlation between the proportion of Dutch and percentage of households with 4 or more vehicles available in the United States with a correlation coefficient (R) of 0.479 and weighted average of 7.7%. Similarly, the statistical analysis conducted on geographies consisting of 60,810,933 people shows no correlation between the proportion of Tlingit-Haida and percentage of households with 4 or more vehicles available in the United States with a correlation coefficient (R) of 0.022 and weighted average of 6.8%, a difference of 11.9%.
4 or more Vehicles in Household Correlation Summary
| Measurement | Dutch | Tlingit-Haida |
| Minimum | 1.7% | 0.99% |
| Maximum | 53.8% | 21.9% |
| Range | 52.2% | 20.9% |
| Mean | 12.3% | 7.9% |
| Median | 9.6% | 6.9% |
| Interquartile 25% (IQ1) | 8.2% | 5.3% |
| Interquartile 75% (IQ3) | 14.0% | 10.5% |
| Interquartile Range (IQR) | 5.8% | 5.2% |
| Standard Deviation (Sample) | 7.9% | 4.6% |
| Standard Deviation (Population) | 7.8% | 4.5% |
Similar Demographics by 4 or more Vehicles in Household
Demographics Similar to Dutch by 4 or more Vehicles in Household
In terms of 4 or more vehicles in household, the demographic groups most similar to Dutch are Malaysian (7.7%, a difference of 0.070%), Immigrants from Oceania (7.6%, a difference of 0.39%), English (7.6%, a difference of 0.41%), Japanese (7.7%, a difference of 0.46%), and Pennsylvania German (7.6%, a difference of 0.53%).
| Demographics | Rating | Rank | 4 or more Vehicles in Household |
| Osage | 100.0 /100 | #47 | Exceptional 7.8% |
| Swiss | 100.0 /100 | #48 | Exceptional 7.8% |
| Cherokee | 100.0 /100 | #49 | Exceptional 7.7% |
| Immigrants | El Salvador | 100.0 /100 | #50 | Exceptional 7.7% |
| Immigrants | Laos | 100.0 /100 | #51 | Exceptional 7.7% |
| Japanese | 100.0 /100 | #52 | Exceptional 7.7% |
| Malaysians | 100.0 /100 | #53 | Exceptional 7.7% |
| Dutch | 100.0 /100 | #54 | Exceptional 7.7% |
| Immigrants | Oceania | 100.0 /100 | #55 | Exceptional 7.6% |
| English | 100.0 /100 | #56 | Exceptional 7.6% |
| Pennsylvania Germans | 100.0 /100 | #57 | Exceptional 7.6% |
| Swedes | 100.0 /100 | #58 | Exceptional 7.6% |
| Hispanics or Latinos | 100.0 /100 | #59 | Exceptional 7.6% |
| Spaniards | 100.0 /100 | #60 | Exceptional 7.6% |
| Europeans | 100.0 /100 | #61 | Exceptional 7.6% |
Demographics Similar to Tlingit-Haida by 4 or more Vehicles in Household
In terms of 4 or more vehicles in household, the demographic groups most similar to Tlingit-Haida are Bolivian (6.8%, a difference of 0.060%), Canadian (6.9%, a difference of 0.11%), Immigrants from Guatemala (6.8%, a difference of 0.26%), Burmese (6.8%, a difference of 0.28%), and French American Indian (6.8%, a difference of 0.28%).
| Demographics | Rating | Rank | 4 or more Vehicles in Household |
| French | 97.7 /100 | #108 | Exceptional 6.9% |
| Filipinos | 97.6 /100 | #109 | Exceptional 6.9% |
| Immigrants | Thailand | 97.0 /100 | #110 | Exceptional 6.9% |
| Aleuts | 97.0 /100 | #111 | Exceptional 6.9% |
| Hopi | 97.0 /100 | #112 | Exceptional 6.9% |
| Canadians | 96.4 /100 | #113 | Exceptional 6.9% |
| Bolivians | 96.3 /100 | #114 | Exceptional 6.8% |
| Tlingit-Haida | 96.2 /100 | #115 | Exceptional 6.8% |
| Immigrants | Guatemala | 95.8 /100 | #116 | Exceptional 6.8% |
| Burmese | 95.7 /100 | #117 | Exceptional 6.8% |
| French American Indians | 95.7 /100 | #118 | Exceptional 6.8% |
| Costa Ricans | 95.5 /100 | #119 | Exceptional 6.8% |
| Comanche | 94.8 /100 | #120 | Exceptional 6.8% |
| Immigrants | Germany | 94.7 /100 | #121 | Exceptional 6.8% |
| Immigrants | Nicaragua | 94.7 /100 | #122 | Exceptional 6.8% |