Cypriot vs Turkish 4 or more Vehicles in Household
COMPARE
Cypriot
Turkish
4 or more Vehicles in Household
4 or more Vehicles in Household Comparison
Cypriots
Turks
5.0%
4 OR MORE VEHICLES IN HOUSEHOLD
0.0/ 100
METRIC RATING
304th/ 347
METRIC RANK
5.8%
4 OR MORE VEHICLES IN HOUSEHOLD
4.1/ 100
METRIC RATING
237th/ 347
METRIC RANK
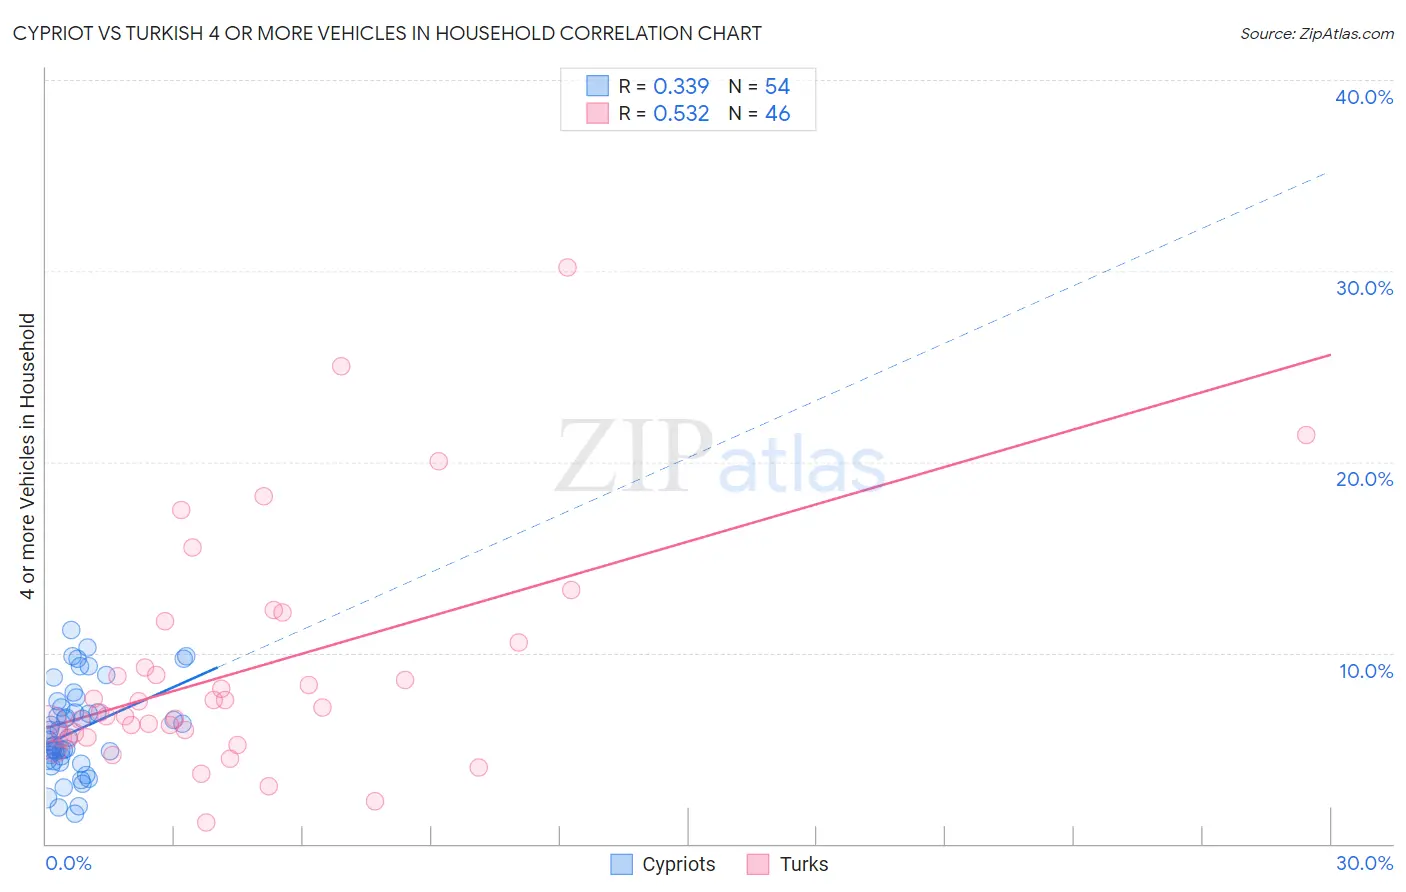
Cypriot vs Turkish 4 or more Vehicles in Household Correlation Chart
The statistical analysis conducted on geographies consisting of 61,625,264 people shows a mild positive correlation between the proportion of Cypriots and percentage of households with 4 or more vehicles available in the United States with a correlation coefficient (R) of 0.339 and weighted average of 5.0%. Similarly, the statistical analysis conducted on geographies consisting of 270,554,311 people shows a substantial positive correlation between the proportion of Turks and percentage of households with 4 or more vehicles available in the United States with a correlation coefficient (R) of 0.532 and weighted average of 5.8%, a difference of 15.9%.
4 or more Vehicles in Household Correlation Summary
| Measurement | Cypriot | Turkish |
| Minimum | 1.6% | 1.1% |
| Maximum | 11.2% | 30.2% |
| Range | 9.6% | 29.1% |
| Mean | 5.9% | 9.1% |
| Median | 5.6% | 7.0% |
| Interquartile 25% (IQ1) | 4.4% | 5.6% |
| Interquartile 75% (IQ3) | 7.1% | 10.5% |
| Interquartile Range (IQR) | 2.7% | 4.9% |
| Standard Deviation (Sample) | 2.3% | 6.0% |
| Standard Deviation (Population) | 2.3% | 5.9% |
Similar Demographics by 4 or more Vehicles in Household
Demographics Similar to Cypriots by 4 or more Vehicles in Household
In terms of 4 or more vehicles in household, the demographic groups most similar to Cypriots are Somali (5.0%, a difference of 0.0%), Immigrants from Serbia (5.0%, a difference of 0.090%), Immigrants from Greece (5.1%, a difference of 0.55%), Bahamian (5.1%, a difference of 1.0%), and Menominee (5.0%, a difference of 1.0%).
| Demographics | Rating | Rank | 4 or more Vehicles in Household |
| Immigrants | Venezuela | 0.1 /100 | #297 | Tragic 5.2% |
| Immigrants | South America | 0.1 /100 | #298 | Tragic 5.2% |
| Immigrants | Ghana | 0.1 /100 | #299 | Tragic 5.2% |
| Immigrants | Morocco | 0.0 /100 | #300 | Tragic 5.1% |
| Immigrants | Zaire | 0.0 /100 | #301 | Tragic 5.1% |
| Bahamians | 0.0 /100 | #302 | Tragic 5.1% |
| Immigrants | Greece | 0.0 /100 | #303 | Tragic 5.1% |
| Cypriots | 0.0 /100 | #304 | Tragic 5.0% |
| Somalis | 0.0 /100 | #305 | Tragic 5.0% |
| Immigrants | Serbia | 0.0 /100 | #306 | Tragic 5.0% |
| Menominee | 0.0 /100 | #307 | Tragic 5.0% |
| Paraguayans | 0.0 /100 | #308 | Tragic 4.9% |
| Immigrants | Somalia | 0.0 /100 | #309 | Tragic 4.9% |
| Moroccans | 0.0 /100 | #310 | Tragic 4.9% |
| Houma | 0.0 /100 | #311 | Tragic 4.9% |
Demographics Similar to Turks by 4 or more Vehicles in Household
In terms of 4 or more vehicles in household, the demographic groups most similar to Turks are Immigrants from Belgium (5.8%, a difference of 0.13%), Immigrants from Australia (5.8%, a difference of 0.22%), Immigrants from Poland (5.8%, a difference of 0.26%), Immigrants from Eritrea (5.8%, a difference of 0.27%), and Immigrants from Hungary (5.8%, a difference of 0.29%).
| Demographics | Rating | Rank | 4 or more Vehicles in Household |
| Immigrants | Malaysia | 6.7 /100 | #230 | Tragic 5.9% |
| Immigrants | Switzerland | 6.4 /100 | #231 | Tragic 5.9% |
| Immigrants | Argentina | 6.0 /100 | #232 | Tragic 5.9% |
| Sierra Leoneans | 6.0 /100 | #233 | Tragic 5.9% |
| Africans | 4.6 /100 | #234 | Tragic 5.8% |
| Immigrants | Hungary | 4.6 /100 | #235 | Tragic 5.8% |
| Immigrants | Eritrea | 4.5 /100 | #236 | Tragic 5.8% |
| Turks | 4.1 /100 | #237 | Tragic 5.8% |
| Immigrants | Belgium | 4.0 /100 | #238 | Tragic 5.8% |
| Immigrants | Australia | 3.8 /100 | #239 | Tragic 5.8% |
| Immigrants | Poland | 3.8 /100 | #240 | Tragic 5.8% |
| Mongolians | 3.7 /100 | #241 | Tragic 5.8% |
| Immigrants | Middle Africa | 3.4 /100 | #242 | Tragic 5.8% |
| Immigrants | Czechoslovakia | 3.2 /100 | #243 | Tragic 5.8% |
| Ethiopians | 3.2 /100 | #244 | Tragic 5.8% |