Cypriot vs Jordanian 4 or more Vehicles in Household
COMPARE
Cypriot
Jordanian
4 or more Vehicles in Household
4 or more Vehicles in Household Comparison
Cypriots
Jordanians
5.0%
4 OR MORE VEHICLES IN HOUSEHOLD
0.0/ 100
METRIC RATING
304th/ 347
METRIC RANK
6.6%
4 OR MORE VEHICLES IN HOUSEHOLD
82.1/ 100
METRIC RATING
139th/ 347
METRIC RANK
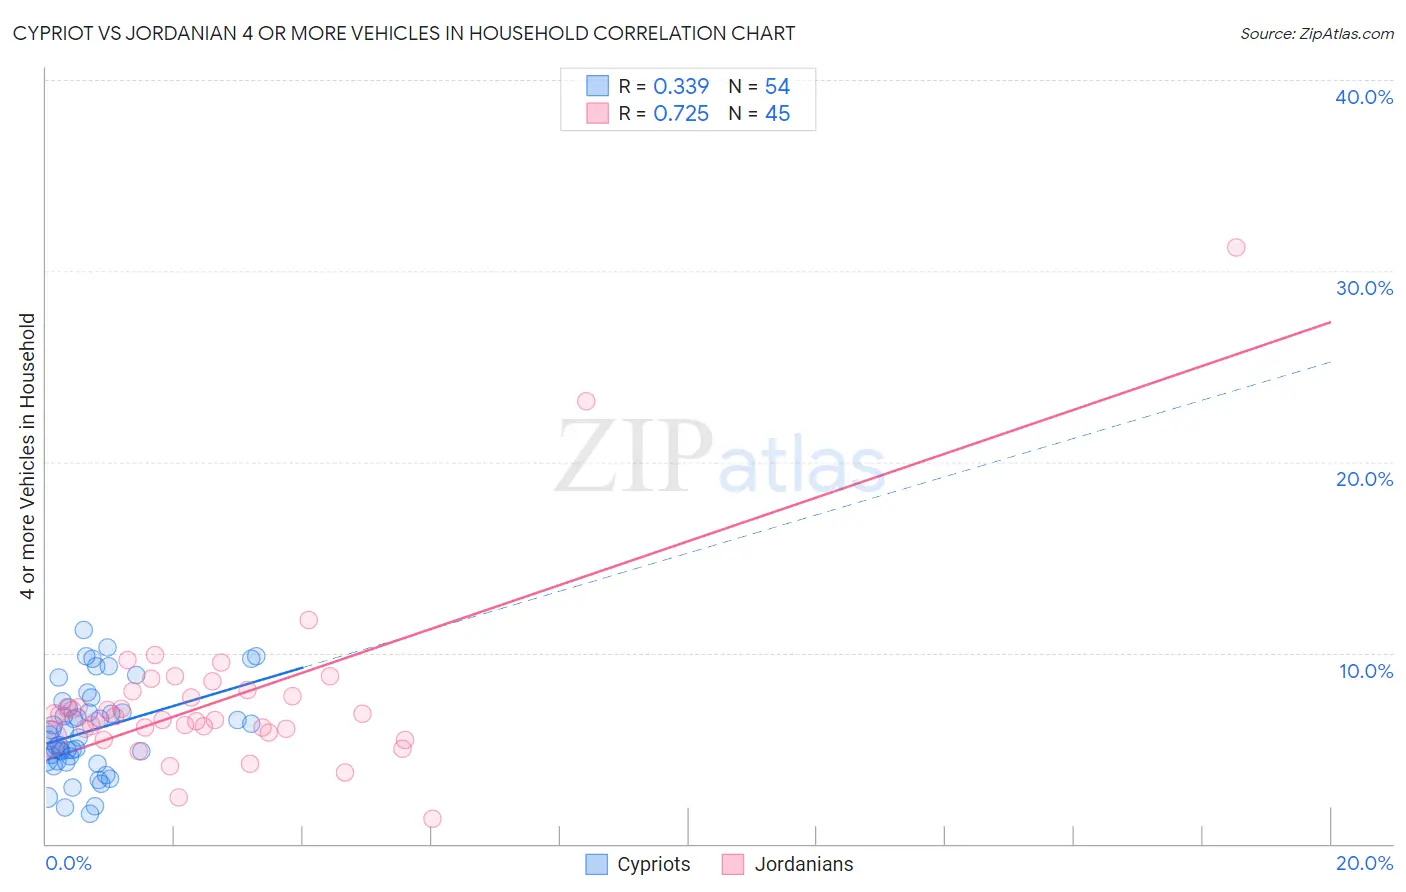
Cypriot vs Jordanian 4 or more Vehicles in Household Correlation Chart
The statistical analysis conducted on geographies consisting of 61,625,264 people shows a mild positive correlation between the proportion of Cypriots and percentage of households with 4 or more vehicles available in the United States with a correlation coefficient (R) of 0.339 and weighted average of 5.0%. Similarly, the statistical analysis conducted on geographies consisting of 166,057,251 people shows a strong positive correlation between the proportion of Jordanians and percentage of households with 4 or more vehicles available in the United States with a correlation coefficient (R) of 0.725 and weighted average of 6.6%, a difference of 30.7%.
4 or more Vehicles in Household Correlation Summary
| Measurement | Cypriot | Jordanian |
| Minimum | 1.6% | 1.3% |
| Maximum | 11.2% | 31.2% |
| Range | 9.6% | 30.0% |
| Mean | 5.9% | 7.6% |
| Median | 5.6% | 6.7% |
| Interquartile 25% (IQ1) | 4.4% | 5.9% |
| Interquartile 75% (IQ3) | 7.1% | 8.0% |
| Interquartile Range (IQR) | 2.7% | 2.1% |
| Standard Deviation (Sample) | 2.3% | 4.8% |
| Standard Deviation (Population) | 2.3% | 4.7% |
Similar Demographics by 4 or more Vehicles in Household
Demographics Similar to Cypriots by 4 or more Vehicles in Household
In terms of 4 or more vehicles in household, the demographic groups most similar to Cypriots are Somali (5.0%, a difference of 0.0%), Immigrants from Serbia (5.0%, a difference of 0.090%), Immigrants from Greece (5.1%, a difference of 0.55%), Bahamian (5.1%, a difference of 1.0%), and Menominee (5.0%, a difference of 1.0%).
| Demographics | Rating | Rank | 4 or more Vehicles in Household |
| Immigrants | Venezuela | 0.1 /100 | #297 | Tragic 5.2% |
| Immigrants | South America | 0.1 /100 | #298 | Tragic 5.2% |
| Immigrants | Ghana | 0.1 /100 | #299 | Tragic 5.2% |
| Immigrants | Morocco | 0.0 /100 | #300 | Tragic 5.1% |
| Immigrants | Zaire | 0.0 /100 | #301 | Tragic 5.1% |
| Bahamians | 0.0 /100 | #302 | Tragic 5.1% |
| Immigrants | Greece | 0.0 /100 | #303 | Tragic 5.1% |
| Cypriots | 0.0 /100 | #304 | Tragic 5.0% |
| Somalis | 0.0 /100 | #305 | Tragic 5.0% |
| Immigrants | Serbia | 0.0 /100 | #306 | Tragic 5.0% |
| Menominee | 0.0 /100 | #307 | Tragic 5.0% |
| Paraguayans | 0.0 /100 | #308 | Tragic 4.9% |
| Immigrants | Somalia | 0.0 /100 | #309 | Tragic 4.9% |
| Moroccans | 0.0 /100 | #310 | Tragic 4.9% |
| Houma | 0.0 /100 | #311 | Tragic 4.9% |
Demographics Similar to Jordanians by 4 or more Vehicles in Household
In terms of 4 or more vehicles in household, the demographic groups most similar to Jordanians are Slavic (6.6%, a difference of 0.080%), Australian (6.6%, a difference of 0.21%), Immigrants from Iraq (6.5%, a difference of 0.41%), Italian (6.6%, a difference of 0.43%), and Immigrants from Canada (6.5%, a difference of 0.54%).
| Demographics | Rating | Rank | 4 or more Vehicles in Household |
| Immigrants | Netherlands | 87.8 /100 | #132 | Excellent 6.6% |
| Armenians | 86.9 /100 | #133 | Excellent 6.6% |
| Ottawa | 86.9 /100 | #134 | Excellent 6.6% |
| Tohono O'odham | 86.7 /100 | #135 | Excellent 6.6% |
| Luxembourgers | 86.4 /100 | #136 | Excellent 6.6% |
| French Canadians | 85.4 /100 | #137 | Excellent 6.6% |
| Italians | 84.5 /100 | #138 | Excellent 6.6% |
| Jordanians | 82.1 /100 | #139 | Excellent 6.6% |
| Slavs | 81.6 /100 | #140 | Excellent 6.6% |
| Australians | 80.8 /100 | #141 | Excellent 6.6% |
| Immigrants | Iraq | 79.4 /100 | #142 | Good 6.5% |
| Immigrants | Canada | 78.6 /100 | #143 | Good 6.5% |
| Immigrants | North America | 78.5 /100 | #144 | Good 6.5% |
| Croatians | 77.8 /100 | #145 | Good 6.5% |
| Immigrants | Costa Rica | 74.4 /100 | #146 | Good 6.5% |