Colombian vs Crow 1 or more Vehicles in Household
COMPARE
Colombian
Crow
1 or more Vehicles in Household
1 or more Vehicles in Household Comparison
Colombians
Crow
88.0%
1 OR MORE VEHICLES IN HOUSEHOLD
0.9/ 100
METRIC RATING
256th/ 347
METRIC RANK
89.3%
1 OR MORE VEHICLES IN HOUSEHOLD
24.3/ 100
METRIC RATING
196th/ 347
METRIC RANK
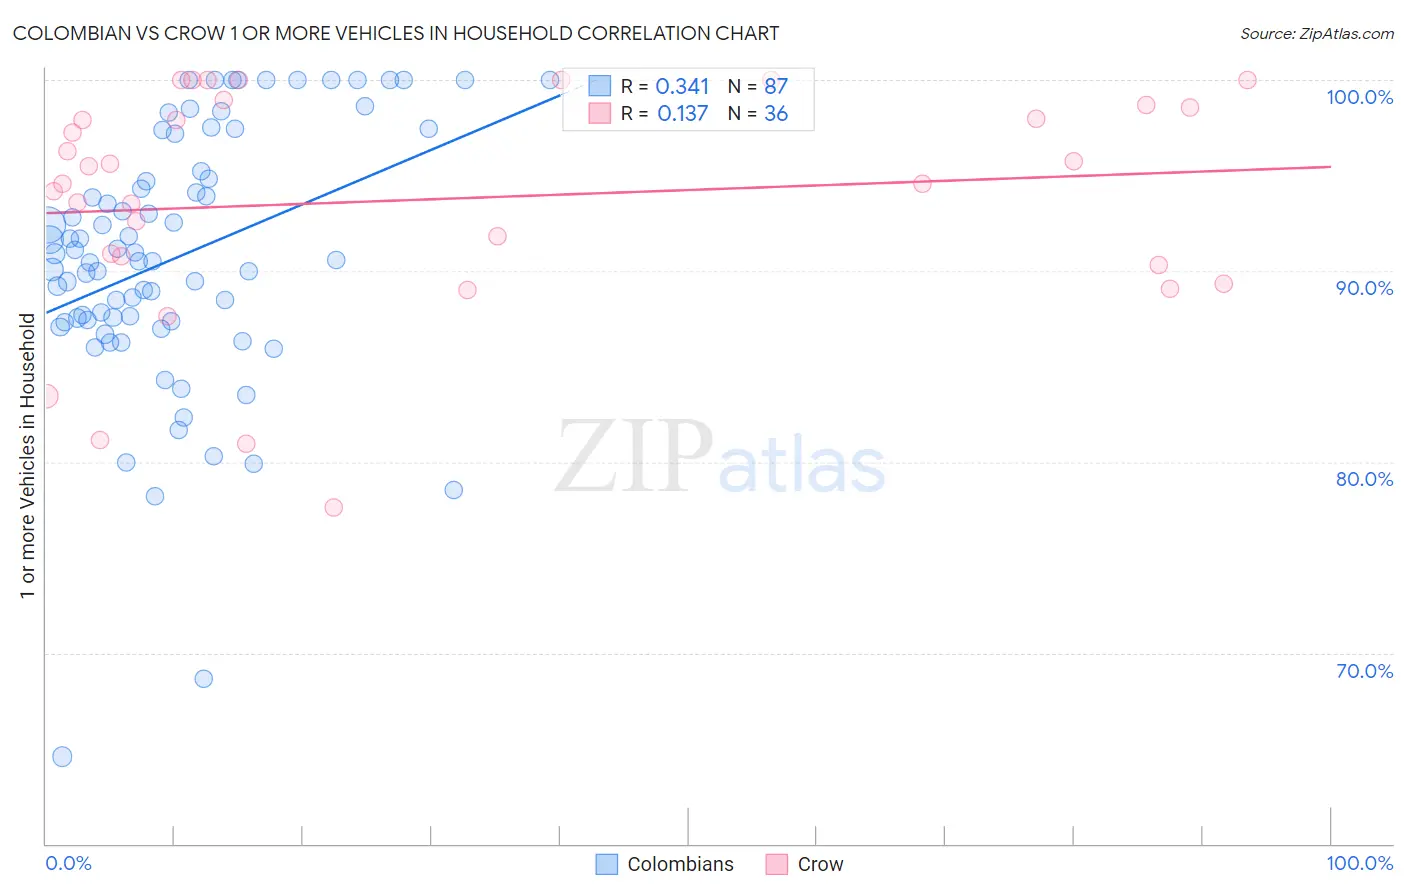
Colombian vs Crow 1 or more Vehicles in Household Correlation Chart
The statistical analysis conducted on geographies consisting of 419,307,896 people shows a mild positive correlation between the proportion of Colombians and percentage of households with 1 or more vehicles available in the United States with a correlation coefficient (R) of 0.341 and weighted average of 88.0%. Similarly, the statistical analysis conducted on geographies consisting of 59,203,156 people shows a poor positive correlation between the proportion of Crow and percentage of households with 1 or more vehicles available in the United States with a correlation coefficient (R) of 0.137 and weighted average of 89.3%, a difference of 1.4%.
1 or more Vehicles in Household Correlation Summary
| Measurement | Colombian | Crow |
| Minimum | 64.6% | 77.6% |
| Maximum | 100.0% | 100.0% |
| Range | 35.4% | 22.4% |
| Mean | 90.7% | 93.8% |
| Median | 90.6% | 95.0% |
| Interquartile 25% (IQ1) | 87.4% | 90.5% |
| Interquartile 75% (IQ3) | 95.2% | 98.6% |
| Interquartile Range (IQR) | 7.9% | 8.1% |
| Standard Deviation (Sample) | 6.8% | 6.0% |
| Standard Deviation (Population) | 6.8% | 5.9% |
Similar Demographics by 1 or more Vehicles in Household
Demographics Similar to Colombians by 1 or more Vehicles in Household
In terms of 1 or more vehicles in household, the demographic groups most similar to Colombians are Liberian (88.0%, a difference of 0.0%), Immigrants from Latvia (88.1%, a difference of 0.010%), South American Indian (88.0%, a difference of 0.010%), Haitian (88.1%, a difference of 0.030%), and Honduran (88.1%, a difference of 0.040%).
| Demographics | Rating | Rank | 1 or more Vehicles in Household |
| Blacks/African Americans | 1.4 /100 | #249 | Tragic 88.2% |
| Egyptians | 1.2 /100 | #250 | Tragic 88.2% |
| Immigrants | Serbia | 1.2 /100 | #251 | Tragic 88.2% |
| Immigrants | Uruguay | 1.1 /100 | #252 | Tragic 88.1% |
| Hondurans | 1.0 /100 | #253 | Tragic 88.1% |
| Haitians | 0.9 /100 | #254 | Tragic 88.1% |
| Immigrants | Latvia | 0.9 /100 | #255 | Tragic 88.1% |
| Colombians | 0.9 /100 | #256 | Tragic 88.0% |
| Liberians | 0.9 /100 | #257 | Tragic 88.0% |
| South American Indians | 0.9 /100 | #258 | Tragic 88.0% |
| Nigerians | 0.8 /100 | #259 | Tragic 88.0% |
| Macedonians | 0.6 /100 | #260 | Tragic 87.9% |
| Immigrants | Switzerland | 0.6 /100 | #261 | Tragic 87.9% |
| Sub-Saharan Africans | 0.5 /100 | #262 | Tragic 87.9% |
| Immigrants | Egypt | 0.5 /100 | #263 | Tragic 87.8% |
Demographics Similar to Crow by 1 or more Vehicles in Household
In terms of 1 or more vehicles in household, the demographic groups most similar to Crow are Immigrants from Sweden (89.3%, a difference of 0.010%), Pennsylvania German (89.3%, a difference of 0.030%), Immigrants from Asia (89.3%, a difference of 0.030%), Central American (89.2%, a difference of 0.060%), and Immigrants from Western Europe (89.2%, a difference of 0.090%).
| Demographics | Rating | Rank | 1 or more Vehicles in Household |
| Carpatho Rusyns | 37.8 /100 | #189 | Fair 89.5% |
| Shoshone | 37.5 /100 | #190 | Fair 89.5% |
| Immigrants | Poland | 37.1 /100 | #191 | Fair 89.5% |
| Immigrants | North Macedonia | 36.5 /100 | #192 | Fair 89.5% |
| Immigrants | Northern Europe | 35.5 /100 | #193 | Fair 89.5% |
| Immigrants | Eritrea | 33.2 /100 | #194 | Fair 89.4% |
| Immigrants | Armenia | 31.8 /100 | #195 | Fair 89.4% |
| Crow | 24.3 /100 | #196 | Fair 89.3% |
| Immigrants | Sweden | 23.6 /100 | #197 | Fair 89.3% |
| Pennsylvania Germans | 22.9 /100 | #198 | Fair 89.3% |
| Immigrants | Asia | 22.8 /100 | #199 | Fair 89.3% |
| Central Americans | 21.4 /100 | #200 | Fair 89.2% |
| Immigrants | Western Europe | 20.5 /100 | #201 | Fair 89.2% |
| Iroquois | 19.8 /100 | #202 | Poor 89.2% |
| Cambodians | 18.9 /100 | #203 | Poor 89.2% |