Colombian vs Immigrants from Hong Kong 1 or more Vehicles in Household
COMPARE
Colombian
Immigrants from Hong Kong
1 or more Vehicles in Household
1 or more Vehicles in Household Comparison
Colombians
Immigrants from Hong Kong
88.0%
1 OR MORE VEHICLES IN HOUSEHOLD
0.9/ 100
METRIC RATING
256th/ 347
METRIC RANK
88.7%
1 OR MORE VEHICLES IN HOUSEHOLD
6.2/ 100
METRIC RATING
224th/ 347
METRIC RANK
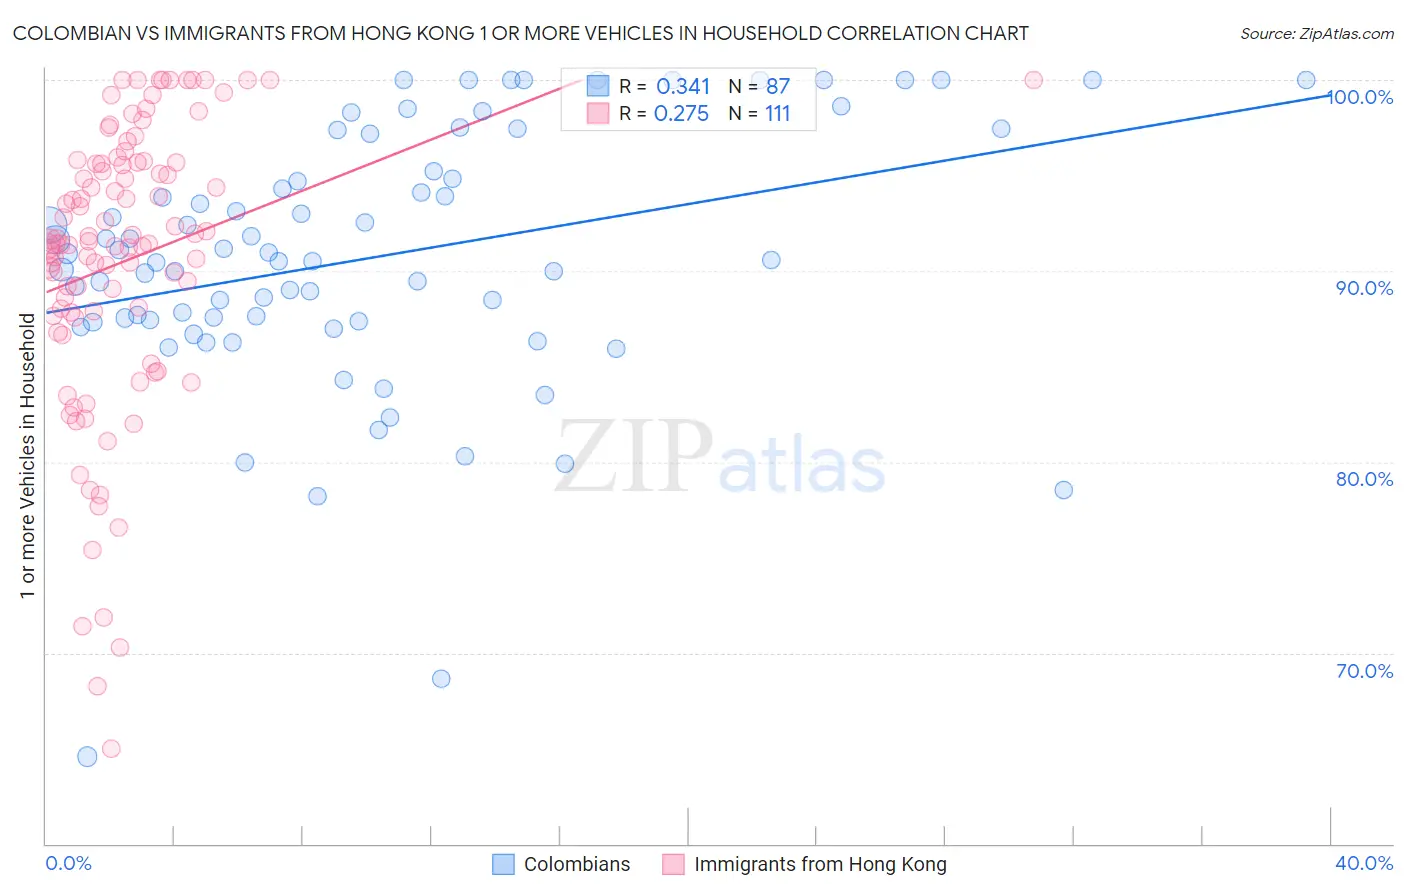
Colombian vs Immigrants from Hong Kong 1 or more Vehicles in Household Correlation Chart
The statistical analysis conducted on geographies consisting of 419,307,896 people shows a mild positive correlation between the proportion of Colombians and percentage of households with 1 or more vehicles available in the United States with a correlation coefficient (R) of 0.341 and weighted average of 88.0%. Similarly, the statistical analysis conducted on geographies consisting of 243,312,585 people shows a weak positive correlation between the proportion of Immigrants from Hong Kong and percentage of households with 1 or more vehicles available in the United States with a correlation coefficient (R) of 0.275 and weighted average of 88.7%, a difference of 0.80%.
1 or more Vehicles in Household Correlation Summary
| Measurement | Colombian | Immigrants from Hong Kong |
| Minimum | 64.6% | 65.0% |
| Maximum | 100.0% | 100.0% |
| Range | 35.4% | 35.0% |
| Mean | 90.7% | 90.5% |
| Median | 90.6% | 91.4% |
| Interquartile 25% (IQ1) | 87.4% | 87.7% |
| Interquartile 75% (IQ3) | 95.2% | 95.7% |
| Interquartile Range (IQR) | 7.9% | 8.0% |
| Standard Deviation (Sample) | 6.8% | 7.5% |
| Standard Deviation (Population) | 6.8% | 7.5% |
Similar Demographics by 1 or more Vehicles in Household
Demographics Similar to Colombians by 1 or more Vehicles in Household
In terms of 1 or more vehicles in household, the demographic groups most similar to Colombians are Liberian (88.0%, a difference of 0.0%), Immigrants from Latvia (88.1%, a difference of 0.010%), South American Indian (88.0%, a difference of 0.010%), Haitian (88.1%, a difference of 0.030%), and Honduran (88.1%, a difference of 0.040%).
| Demographics | Rating | Rank | 1 or more Vehicles in Household |
| Blacks/African Americans | 1.4 /100 | #249 | Tragic 88.2% |
| Egyptians | 1.2 /100 | #250 | Tragic 88.2% |
| Immigrants | Serbia | 1.2 /100 | #251 | Tragic 88.2% |
| Immigrants | Uruguay | 1.1 /100 | #252 | Tragic 88.1% |
| Hondurans | 1.0 /100 | #253 | Tragic 88.1% |
| Haitians | 0.9 /100 | #254 | Tragic 88.1% |
| Immigrants | Latvia | 0.9 /100 | #255 | Tragic 88.1% |
| Colombians | 0.9 /100 | #256 | Tragic 88.0% |
| Liberians | 0.9 /100 | #257 | Tragic 88.0% |
| South American Indians | 0.9 /100 | #258 | Tragic 88.0% |
| Nigerians | 0.8 /100 | #259 | Tragic 88.0% |
| Macedonians | 0.6 /100 | #260 | Tragic 87.9% |
| Immigrants | Switzerland | 0.6 /100 | #261 | Tragic 87.9% |
| Sub-Saharan Africans | 0.5 /100 | #262 | Tragic 87.9% |
| Immigrants | Egypt | 0.5 /100 | #263 | Tragic 87.8% |
Demographics Similar to Immigrants from Hong Kong by 1 or more Vehicles in Household
In terms of 1 or more vehicles in household, the demographic groups most similar to Immigrants from Hong Kong are Cree (88.7%, a difference of 0.010%), Cheyenne (88.7%, a difference of 0.040%), Ute (88.7%, a difference of 0.040%), Uruguayan (88.8%, a difference of 0.050%), and Immigrants from South America (88.8%, a difference of 0.050%).
| Demographics | Rating | Rank | 1 or more Vehicles in Household |
| Argentineans | 8.8 /100 | #217 | Tragic 88.9% |
| Ugandans | 8.7 /100 | #218 | Tragic 88.9% |
| Immigrants | Guatemala | 8.6 /100 | #219 | Tragic 88.9% |
| Immigrants | Zaire | 8.1 /100 | #220 | Tragic 88.8% |
| Peruvians | 7.9 /100 | #221 | Tragic 88.8% |
| Uruguayans | 7.0 /100 | #222 | Tragic 88.8% |
| Immigrants | South America | 7.0 /100 | #223 | Tragic 88.8% |
| Immigrants | Hong Kong | 6.2 /100 | #224 | Tragic 88.7% |
| Cree | 6.0 /100 | #225 | Tragic 88.7% |
| Cheyenne | 5.7 /100 | #226 | Tragic 88.7% |
| Ute | 5.6 /100 | #227 | Tragic 88.7% |
| Immigrants | Norway | 5.5 /100 | #228 | Tragic 88.7% |
| Immigrants | Romania | 5.4 /100 | #229 | Tragic 88.7% |
| Immigrants | Sierra Leone | 5.2 /100 | #230 | Tragic 88.7% |
| Russians | 5.0 /100 | #231 | Tragic 88.7% |