Chickasaw vs Immigrants from Ukraine No Vehicles in Household
COMPARE
Chickasaw
Immigrants from Ukraine
No Vehicles in Household
No Vehicles in Household Comparison
Chickasaw
Immigrants from Ukraine
7.9%
NO VEHICLES IN HOUSEHOLD
99.9/ 100
METRIC RATING
43rd/ 347
METRIC RANK
14.9%
NO VEHICLES IN HOUSEHOLD
0.0/ 100
METRIC RATING
301st/ 347
METRIC RANK
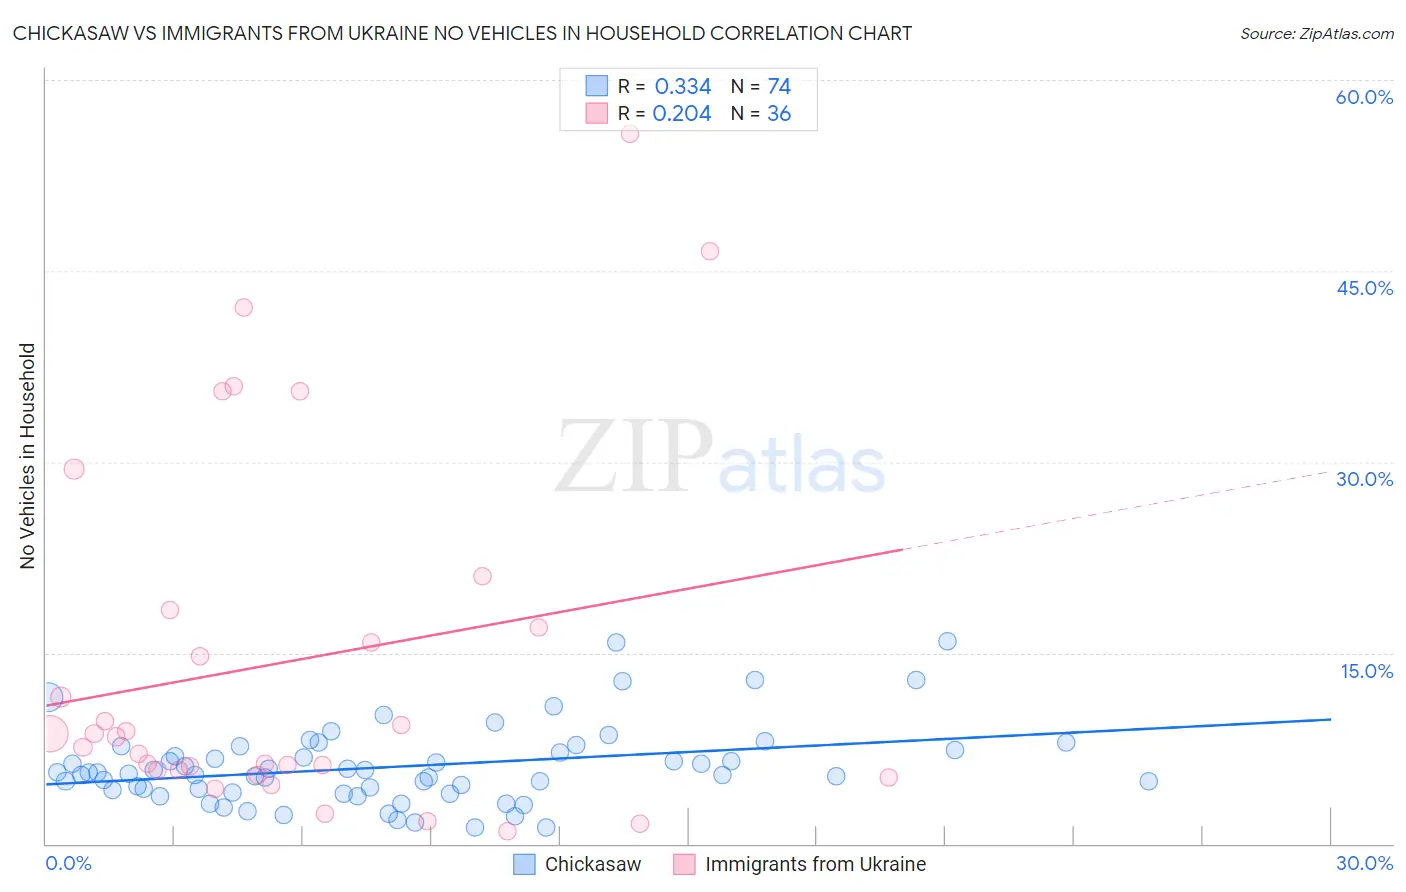
Chickasaw vs Immigrants from Ukraine No Vehicles in Household Correlation Chart
The statistical analysis conducted on geographies consisting of 147,505,491 people shows a mild positive correlation between the proportion of Chickasaw and percentage of households with no vehicle available in the United States with a correlation coefficient (R) of 0.334 and weighted average of 7.9%. Similarly, the statistical analysis conducted on geographies consisting of 289,279,042 people shows a weak positive correlation between the proportion of Immigrants from Ukraine and percentage of households with no vehicle available in the United States with a correlation coefficient (R) of 0.204 and weighted average of 14.9%, a difference of 89.0%.
No Vehicles in Household Correlation Summary
| Measurement | Chickasaw | Immigrants from Ukraine |
| Minimum | 1.3% | 1.0% |
| Maximum | 15.9% | 55.8% |
| Range | 14.6% | 54.7% |
| Mean | 6.1% | 14.3% |
| Median | 5.5% | 8.5% |
| Interquartile 25% (IQ1) | 4.2% | 5.8% |
| Interquartile 75% (IQ3) | 7.4% | 17.6% |
| Interquartile Range (IQR) | 3.2% | 11.8% |
| Standard Deviation (Sample) | 3.1% | 14.1% |
| Standard Deviation (Population) | 3.0% | 13.9% |
Similar Demographics by No Vehicles in Household
Demographics Similar to Chickasaw by No Vehicles in Household
In terms of no vehicles in household, the demographic groups most similar to Chickasaw are Swiss (7.9%, a difference of 0.080%), French Canadian (7.8%, a difference of 0.21%), Czechoslovakian (7.8%, a difference of 0.36%), Choctaw (7.9%, a difference of 0.36%), and Immigrants from Fiji (7.8%, a difference of 0.46%).
| Demographics | Rating | Rank | No Vehicles in Household |
| Iraqis | 99.9 /100 | #36 | Exceptional 7.7% |
| Basques | 99.9 /100 | #37 | Exceptional 7.8% |
| Creek | 99.9 /100 | #38 | Exceptional 7.8% |
| Immigrants | Fiji | 99.9 /100 | #39 | Exceptional 7.8% |
| Czechoslovakians | 99.9 /100 | #40 | Exceptional 7.8% |
| French Canadians | 99.9 /100 | #41 | Exceptional 7.8% |
| Swiss | 99.9 /100 | #42 | Exceptional 7.9% |
| Chickasaw | 99.9 /100 | #43 | Exceptional 7.9% |
| Choctaw | 99.9 /100 | #44 | Exceptional 7.9% |
| Immigrants | Nonimmigrants | 99.9 /100 | #45 | Exceptional 7.9% |
| Spanish | 99.9 /100 | #46 | Exceptional 7.9% |
| Northern Europeans | 99.9 /100 | #47 | Exceptional 7.9% |
| Afghans | 99.9 /100 | #48 | Exceptional 8.0% |
| Guamanians/Chamorros | 99.9 /100 | #49 | Exceptional 8.0% |
| Belgians | 99.9 /100 | #50 | Exceptional 8.0% |
Demographics Similar to Immigrants from Ukraine by No Vehicles in Household
In terms of no vehicles in household, the demographic groups most similar to Immigrants from Ukraine are Yuman (14.9%, a difference of 0.0%), Haitian (14.9%, a difference of 0.47%), Immigrants from Western Africa (15.0%, a difference of 0.99%), Immigrants from Greece (14.7%, a difference of 1.1%), and Moroccan (14.7%, a difference of 1.3%).
| Demographics | Rating | Rank | No Vehicles in Household |
| Belizeans | 0.0 /100 | #294 | Tragic 14.3% |
| Paraguayans | 0.0 /100 | #295 | Tragic 14.4% |
| Immigrants | Spain | 0.0 /100 | #296 | Tragic 14.5% |
| Immigrants | Panama | 0.0 /100 | #297 | Tragic 14.6% |
| Moroccans | 0.0 /100 | #298 | Tragic 14.7% |
| Immigrants | Greece | 0.0 /100 | #299 | Tragic 14.7% |
| Yuman | 0.0 /100 | #300 | Tragic 14.9% |
| Immigrants | Ukraine | 0.0 /100 | #301 | Tragic 14.9% |
| Haitians | 0.0 /100 | #302 | Tragic 14.9% |
| Immigrants | Western Africa | 0.0 /100 | #303 | Tragic 15.0% |
| Immigrants | Russia | 0.0 /100 | #304 | Tragic 15.1% |
| Immigrants | China | 0.0 /100 | #305 | Tragic 15.2% |
| Immigrants | Belize | 0.0 /100 | #306 | Tragic 15.4% |
| Immigrants | Haiti | 0.0 /100 | #307 | Tragic 15.4% |
| U.S. Virgin Islanders | 0.0 /100 | #308 | Tragic 15.4% |