British West Indian vs Immigrants from Ukraine No Vehicles in Household
COMPARE
British West Indian
Immigrants from Ukraine
No Vehicles in Household
No Vehicles in Household Comparison
British West Indians
Immigrants from Ukraine
29.7%
NO VEHICLES IN HOUSEHOLD
0.0/ 100
METRIC RATING
342nd/ 347
METRIC RANK
14.9%
NO VEHICLES IN HOUSEHOLD
0.0/ 100
METRIC RATING
301st/ 347
METRIC RANK
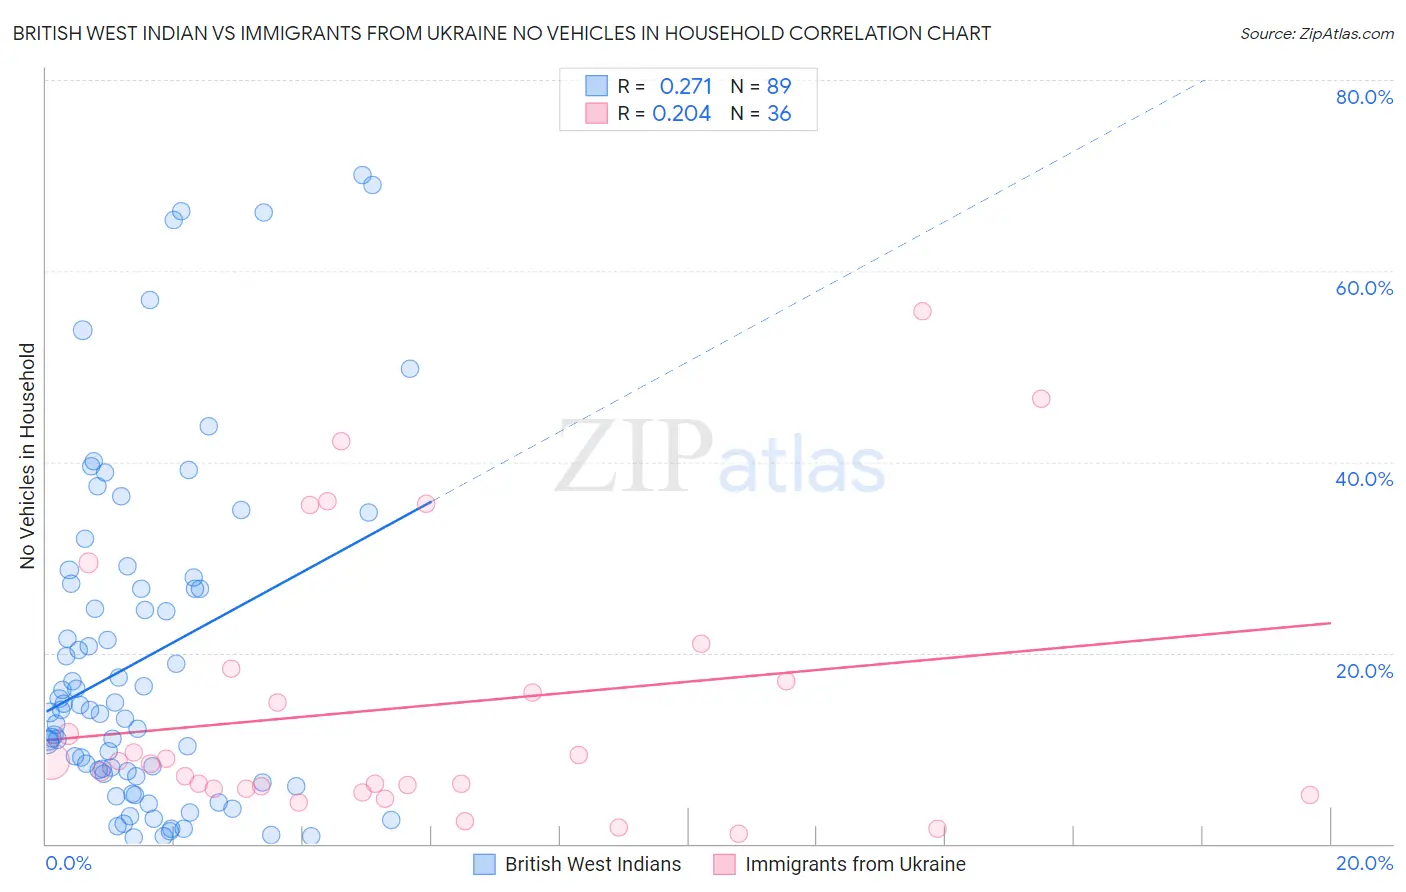
British West Indian vs Immigrants from Ukraine No Vehicles in Household Correlation Chart
The statistical analysis conducted on geographies consisting of 152,511,245 people shows a weak positive correlation between the proportion of British West Indians and percentage of households with no vehicle available in the United States with a correlation coefficient (R) of 0.271 and weighted average of 29.7%. Similarly, the statistical analysis conducted on geographies consisting of 289,279,042 people shows a weak positive correlation between the proportion of Immigrants from Ukraine and percentage of households with no vehicle available in the United States with a correlation coefficient (R) of 0.204 and weighted average of 14.9%, a difference of 100.3%.
No Vehicles in Household Correlation Summary
| Measurement | British West Indian | Immigrants from Ukraine |
| Minimum | 0.70% | 1.0% |
| Maximum | 70.0% | 55.8% |
| Range | 69.3% | 54.7% |
| Mean | 19.4% | 14.3% |
| Median | 14.1% | 8.5% |
| Interquartile 25% (IQ1) | 7.2% | 5.8% |
| Interquartile 75% (IQ3) | 27.0% | 17.6% |
| Interquartile Range (IQR) | 19.9% | 11.8% |
| Standard Deviation (Sample) | 17.5% | 14.1% |
| Standard Deviation (Population) | 17.4% | 13.9% |
Similar Demographics by No Vehicles in Household
Demographics Similar to British West Indians by No Vehicles in Household
In terms of no vehicles in household, the demographic groups most similar to British West Indians are Inupiat (29.9%, a difference of 0.41%), Immigrants from Guyana (29.5%, a difference of 0.85%), Immigrants from Barbados (29.5%, a difference of 0.90%), Dominican (29.4%, a difference of 1.1%), and Guyanese (29.3%, a difference of 1.5%).
| Demographics | Rating | Rank | No Vehicles in Household |
| Immigrants | Trinidad and Tobago | 0.0 /100 | #333 | Tragic 24.6% |
| Immigrants | Bangladesh | 0.0 /100 | #334 | Tragic 25.8% |
| Barbadians | 0.0 /100 | #335 | Tragic 26.1% |
| Vietnamese | 0.0 /100 | #336 | Tragic 26.2% |
| Immigrants | Uzbekistan | 0.0 /100 | #337 | Tragic 26.7% |
| Guyanese | 0.0 /100 | #338 | Tragic 29.3% |
| Dominicans | 0.0 /100 | #339 | Tragic 29.4% |
| Immigrants | Barbados | 0.0 /100 | #340 | Tragic 29.5% |
| Immigrants | Guyana | 0.0 /100 | #341 | Tragic 29.5% |
| British West Indians | 0.0 /100 | #342 | Tragic 29.7% |
| Inupiat | 0.0 /100 | #343 | Tragic 29.9% |
| Immigrants | Dominican Republic | 0.0 /100 | #344 | Tragic 31.4% |
| Immigrants | St. Vincent and the Grenadines | 0.0 /100 | #345 | Tragic 35.4% |
| Immigrants | Grenada | 0.0 /100 | #346 | Tragic 37.5% |
| Yup'ik | 0.0 /100 | #347 | Tragic 45.9% |
Demographics Similar to Immigrants from Ukraine by No Vehicles in Household
In terms of no vehicles in household, the demographic groups most similar to Immigrants from Ukraine are Yuman (14.9%, a difference of 0.0%), Haitian (14.9%, a difference of 0.47%), Immigrants from Western Africa (15.0%, a difference of 0.99%), Immigrants from Greece (14.7%, a difference of 1.1%), and Moroccan (14.7%, a difference of 1.3%).
| Demographics | Rating | Rank | No Vehicles in Household |
| Belizeans | 0.0 /100 | #294 | Tragic 14.3% |
| Paraguayans | 0.0 /100 | #295 | Tragic 14.4% |
| Immigrants | Spain | 0.0 /100 | #296 | Tragic 14.5% |
| Immigrants | Panama | 0.0 /100 | #297 | Tragic 14.6% |
| Moroccans | 0.0 /100 | #298 | Tragic 14.7% |
| Immigrants | Greece | 0.0 /100 | #299 | Tragic 14.7% |
| Yuman | 0.0 /100 | #300 | Tragic 14.9% |
| Immigrants | Ukraine | 0.0 /100 | #301 | Tragic 14.9% |
| Haitians | 0.0 /100 | #302 | Tragic 14.9% |
| Immigrants | Western Africa | 0.0 /100 | #303 | Tragic 15.0% |
| Immigrants | Russia | 0.0 /100 | #304 | Tragic 15.1% |
| Immigrants | China | 0.0 /100 | #305 | Tragic 15.2% |
| Immigrants | Belize | 0.0 /100 | #306 | Tragic 15.4% |
| Immigrants | Haiti | 0.0 /100 | #307 | Tragic 15.4% |
| U.S. Virgin Islanders | 0.0 /100 | #308 | Tragic 15.4% |