Celtic vs Immigrants from Brazil No Vehicles in Household
COMPARE
Celtic
Immigrants from Brazil
No Vehicles in Household
No Vehicles in Household Comparison
Celtics
Immigrants from Brazil
8.1%
NO VEHICLES IN HOUSEHOLD
99.9/ 100
METRIC RATING
55th/ 347
METRIC RANK
10.8%
NO VEHICLES IN HOUSEHOLD
26.3/ 100
METRIC RATING
195th/ 347
METRIC RANK
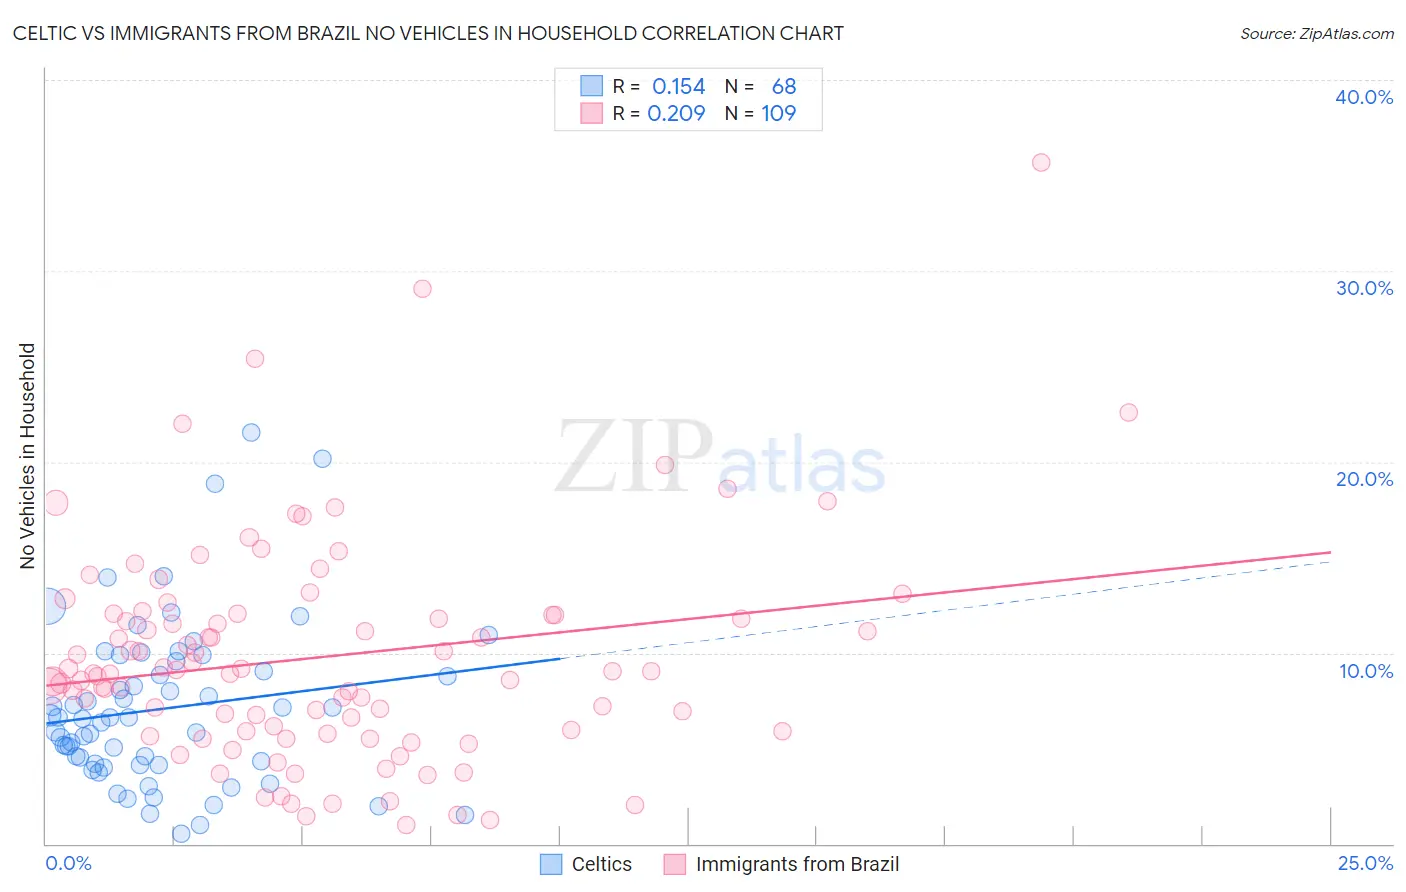
Celtic vs Immigrants from Brazil No Vehicles in Household Correlation Chart
The statistical analysis conducted on geographies consisting of 168,703,210 people shows a poor positive correlation between the proportion of Celtics and percentage of households with no vehicle available in the United States with a correlation coefficient (R) of 0.154 and weighted average of 8.1%. Similarly, the statistical analysis conducted on geographies consisting of 341,931,543 people shows a weak positive correlation between the proportion of Immigrants from Brazil and percentage of households with no vehicle available in the United States with a correlation coefficient (R) of 0.209 and weighted average of 10.8%, a difference of 33.4%.
No Vehicles in Household Correlation Summary
| Measurement | Celtic | Immigrants from Brazil |
| Minimum | 0.51% | 0.95% |
| Maximum | 21.5% | 35.7% |
| Range | 21.0% | 34.7% |
| Mean | 7.1% | 9.8% |
| Median | 6.6% | 8.9% |
| Interquartile 25% (IQ1) | 4.1% | 5.9% |
| Interquartile 75% (IQ3) | 9.3% | 12.0% |
| Interquartile Range (IQR) | 5.1% | 6.1% |
| Standard Deviation (Sample) | 4.3% | 5.8% |
| Standard Deviation (Population) | 4.2% | 5.8% |
Similar Demographics by No Vehicles in Household
Demographics Similar to Celtics by No Vehicles in Household
In terms of no vehicles in household, the demographic groups most similar to Celtics are Immigrants from Venezuela (8.1%, a difference of 0.090%), Immigrants from Afghanistan (8.1%, a difference of 0.39%), Hawaiian (8.0%, a difference of 0.40%), Slovene (8.0%, a difference of 0.40%), and Venezuelan (8.1%, a difference of 0.68%).
| Demographics | Rating | Rank | No Vehicles in Household |
| Afghans | 99.9 /100 | #48 | Exceptional 8.0% |
| Guamanians/Chamorros | 99.9 /100 | #49 | Exceptional 8.0% |
| Belgians | 99.9 /100 | #50 | Exceptional 8.0% |
| Koreans | 99.9 /100 | #51 | Exceptional 8.0% |
| Hawaiians | 99.9 /100 | #52 | Exceptional 8.0% |
| Slovenes | 99.9 /100 | #53 | Exceptional 8.0% |
| Immigrants | Venezuela | 99.9 /100 | #54 | Exceptional 8.1% |
| Celtics | 99.9 /100 | #55 | Exceptional 8.1% |
| Immigrants | Afghanistan | 99.9 /100 | #56 | Exceptional 8.1% |
| Venezuelans | 99.8 /100 | #57 | Exceptional 8.1% |
| Immigrants | Mexico | 99.8 /100 | #58 | Exceptional 8.1% |
| Immigrants | India | 99.8 /100 | #59 | Exceptional 8.2% |
| Immigrants | Laos | 99.8 /100 | #60 | Exceptional 8.2% |
| Thais | 99.8 /100 | #61 | Exceptional 8.2% |
| Chinese | 99.8 /100 | #62 | Exceptional 8.2% |
Demographics Similar to Immigrants from Brazil by No Vehicles in Household
In terms of no vehicles in household, the demographic groups most similar to Immigrants from Brazil are Pueblo (10.8%, a difference of 0.11%), Ukrainian (10.7%, a difference of 0.29%), Central American (10.8%, a difference of 0.34%), Shoshone (10.8%, a difference of 0.38%), and Immigrants from Sweden (10.8%, a difference of 0.59%).
| Demographics | Rating | Rank | No Vehicles in Household |
| Immigrants | Armenia | 37.5 /100 | #188 | Fair 10.6% |
| Immigrants | Eritrea | 36.3 /100 | #189 | Fair 10.6% |
| Immigrants | North Macedonia | 34.6 /100 | #190 | Fair 10.6% |
| Immigrants | Northern Europe | 33.1 /100 | #191 | Fair 10.7% |
| Carpatho Rusyns | 32.1 /100 | #192 | Fair 10.7% |
| Ukrainians | 28.0 /100 | #193 | Fair 10.7% |
| Pueblo | 27.0 /100 | #194 | Fair 10.8% |
| Immigrants | Brazil | 26.3 /100 | #195 | Fair 10.8% |
| Central Americans | 24.3 /100 | #196 | Fair 10.8% |
| Shoshone | 24.1 /100 | #197 | Fair 10.8% |
| Immigrants | Sweden | 22.9 /100 | #198 | Fair 10.8% |
| Immigrants | Asia | 21.3 /100 | #199 | Fair 10.9% |
| Cambodians | 19.6 /100 | #200 | Poor 10.9% |
| Immigrants | Western Europe | 19.1 /100 | #201 | Poor 10.9% |
| Romanians | 17.9 /100 | #202 | Poor 10.9% |