Cape Verdean vs Russian Female Unemployment
COMPARE
Cape Verdean
Russian
Female Unemployment
Female Unemployment Comparison
Cape Verdeans
Russians
5.9%
FEMALE UNEMPLOYMENT
0.0/ 100
METRIC RATING
266th/ 347
METRIC RANK
5.0%
FEMALE UNEMPLOYMENT
98.0/ 100
METRIC RATING
73rd/ 347
METRIC RANK
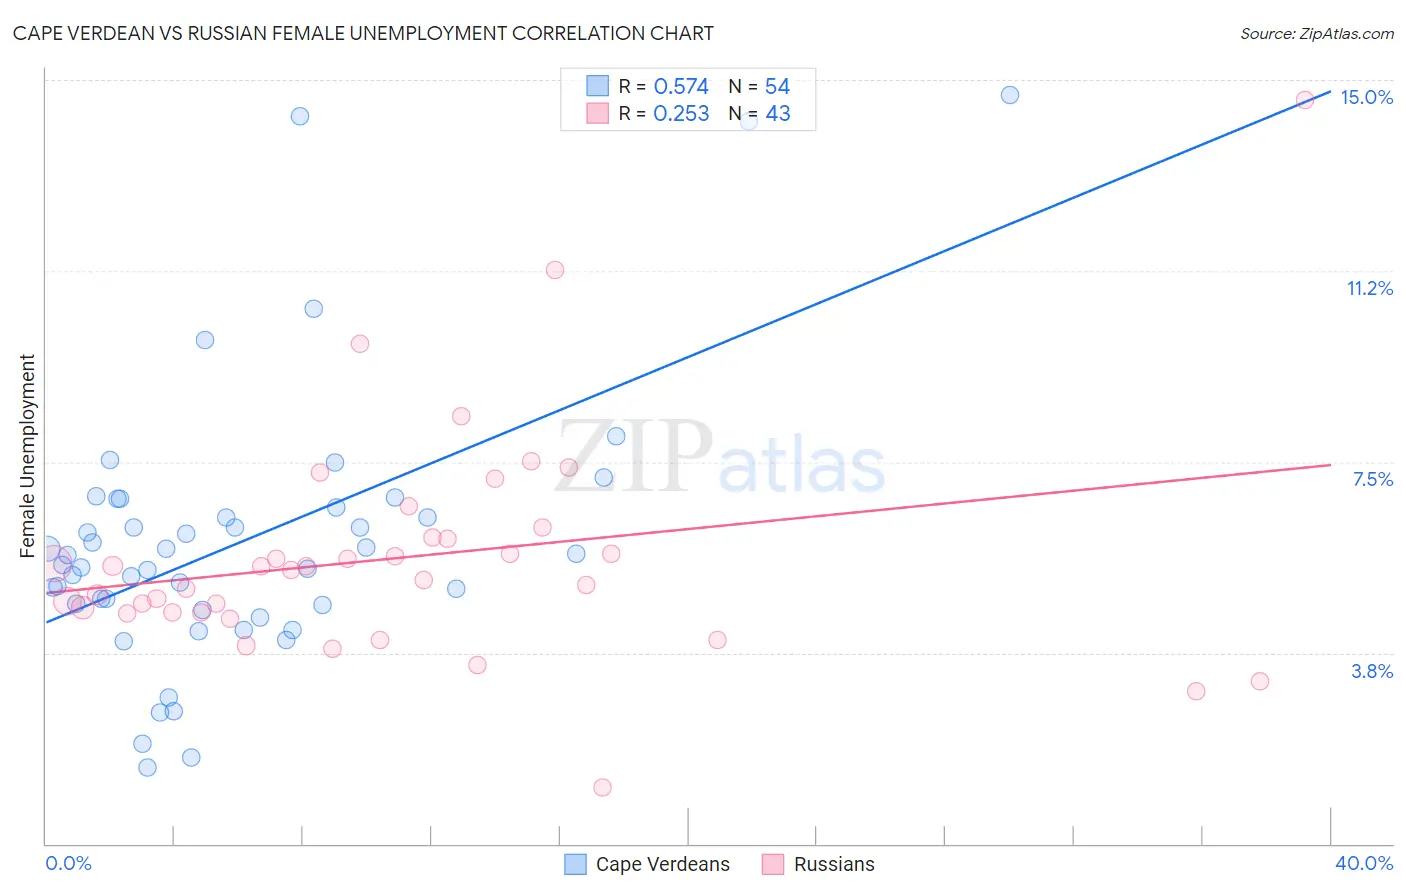
Cape Verdean vs Russian Female Unemployment Correlation Chart
The statistical analysis conducted on geographies consisting of 107,445,837 people shows a substantial positive correlation between the proportion of Cape Verdeans and unemploymnet rate among females in the United States with a correlation coefficient (R) of 0.574 and weighted average of 5.9%. Similarly, the statistical analysis conducted on geographies consisting of 505,214,756 people shows a weak positive correlation between the proportion of Russians and unemploymnet rate among females in the United States with a correlation coefficient (R) of 0.253 and weighted average of 5.0%, a difference of 18.7%.
Female Unemployment Correlation Summary
| Measurement | Cape Verdean | Russian |
| Minimum | 1.5% | 1.1% |
| Maximum | 14.7% | 14.6% |
| Range | 13.2% | 13.5% |
| Mean | 5.9% | 5.6% |
| Median | 5.6% | 5.4% |
| Interquartile 25% (IQ1) | 4.7% | 4.5% |
| Interquartile 75% (IQ3) | 6.6% | 6.0% |
| Interquartile Range (IQR) | 1.9% | 1.5% |
| Standard Deviation (Sample) | 2.7% | 2.2% |
| Standard Deviation (Population) | 2.7% | 2.2% |
Similar Demographics by Female Unemployment
Demographics Similar to Cape Verdeans by Female Unemployment
In terms of female unemployment, the demographic groups most similar to Cape Verdeans are Nepalese (5.9%, a difference of 0.11%), Honduran (5.9%, a difference of 0.20%), Blackfeet (5.9%, a difference of 0.28%), Immigrants from Western Africa (5.9%, a difference of 0.40%), and Immigrants from Bahamas (5.8%, a difference of 0.68%).
| Demographics | Rating | Rank | Female Unemployment |
| Immigrants | Fiji | 0.2 /100 | #259 | Tragic 5.8% |
| Nigerians | 0.2 /100 | #260 | Tragic 5.8% |
| Kiowa | 0.1 /100 | #261 | Tragic 5.8% |
| Immigrants | Nigeria | 0.1 /100 | #262 | Tragic 5.8% |
| Immigrants | Azores | 0.1 /100 | #263 | Tragic 5.8% |
| Immigrants | Bahamas | 0.1 /100 | #264 | Tragic 5.8% |
| Blackfeet | 0.0 /100 | #265 | Tragic 5.9% |
| Cape Verdeans | 0.0 /100 | #266 | Tragic 5.9% |
| Nepalese | 0.0 /100 | #267 | Tragic 5.9% |
| Hondurans | 0.0 /100 | #268 | Tragic 5.9% |
| Immigrants | Western Africa | 0.0 /100 | #269 | Tragic 5.9% |
| Immigrants | Honduras | 0.0 /100 | #270 | Tragic 5.9% |
| Central Americans | 0.0 /100 | #271 | Tragic 5.9% |
| Lumbee | 0.0 /100 | #272 | Tragic 5.9% |
| Ghanaians | 0.0 /100 | #273 | Tragic 5.9% |
Demographics Similar to Russians by Female Unemployment
In terms of female unemployment, the demographic groups most similar to Russians are Immigrants from Bolivia (5.0%, a difference of 0.010%), Immigrants from Northern Europe (4.9%, a difference of 0.030%), Immigrants from Singapore (5.0%, a difference of 0.030%), Immigrants from Venezuela (5.0%, a difference of 0.040%), and German Russian (4.9%, a difference of 0.10%).
| Demographics | Rating | Rank | Female Unemployment |
| Hungarians | 98.3 /100 | #66 | Exceptional 4.9% |
| Cubans | 98.3 /100 | #67 | Exceptional 4.9% |
| Tlingit-Haida | 98.3 /100 | #68 | Exceptional 4.9% |
| Immigrants | Ireland | 98.2 /100 | #69 | Exceptional 4.9% |
| Osage | 98.2 /100 | #70 | Exceptional 4.9% |
| German Russians | 98.1 /100 | #71 | Exceptional 4.9% |
| Immigrants | Northern Europe | 98.0 /100 | #72 | Exceptional 4.9% |
| Russians | 98.0 /100 | #73 | Exceptional 5.0% |
| Immigrants | Bolivia | 98.0 /100 | #74 | Exceptional 5.0% |
| Immigrants | Singapore | 98.0 /100 | #75 | Exceptional 5.0% |
| Immigrants | Venezuela | 97.9 /100 | #76 | Exceptional 5.0% |
| Mongolians | 97.8 /100 | #77 | Exceptional 5.0% |
| Immigrants | Netherlands | 97.8 /100 | #78 | Exceptional 5.0% |
| Turks | 97.6 /100 | #79 | Exceptional 5.0% |
| New Zealanders | 97.4 /100 | #80 | Exceptional 5.0% |