Canadian vs Yup'ik Unemployment Among Women with Children Under 18 years
COMPARE
Canadian
Yup'ik
Unemployment Among Women with Children Under 18 years
Unemployment Among Women with Children Under 18 years Comparison
Canadians
Yup'ik
5.3%
UNEMPLOYMENT AMONG WOMEN WITH CHILDREN UNDER 18 YEARS
87.4/ 100
METRIC RATING
117th/ 347
METRIC RANK
11.0%
UNEMPLOYMENT AMONG WOMEN WITH CHILDREN UNDER 18 YEARS
0.0/ 100
METRIC RATING
346th/ 347
METRIC RANK
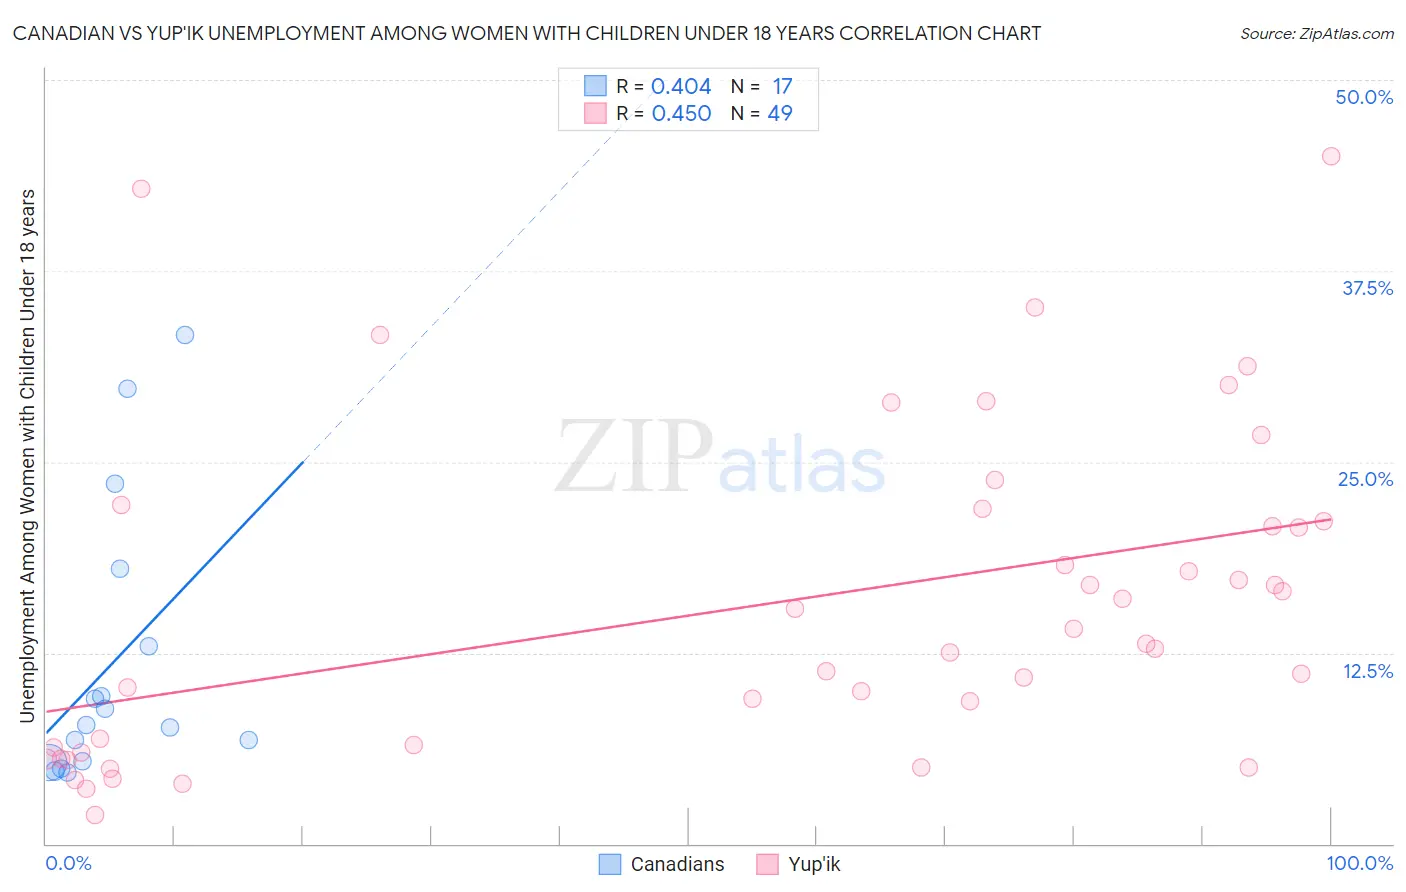
Canadian vs Yup'ik Unemployment Among Women with Children Under 18 years Correlation Chart
The statistical analysis conducted on geographies consisting of 412,682,784 people shows a moderate positive correlation between the proportion of Canadians and unemployment rate among women with children under the age of 18 in the United States with a correlation coefficient (R) of 0.404 and weighted average of 5.3%. Similarly, the statistical analysis conducted on geographies consisting of 39,461,046 people shows a moderate positive correlation between the proportion of Yup'ik and unemployment rate among women with children under the age of 18 in the United States with a correlation coefficient (R) of 0.450 and weighted average of 11.0%, a difference of 109.6%.
Unemployment Among Women with Children Under 18 years Correlation Summary
| Measurement | Canadian | Yup'ik |
| Minimum | 4.7% | 1.9% |
| Maximum | 33.3% | 45.0% |
| Range | 28.6% | 43.1% |
| Mean | 11.7% | 15.7% |
| Median | 7.7% | 13.1% |
| Interquartile 25% (IQ1) | 5.4% | 6.1% |
| Interquartile 75% (IQ3) | 15.5% | 21.5% |
| Interquartile Range (IQR) | 10.1% | 15.4% |
| Standard Deviation (Sample) | 9.0% | 10.6% |
| Standard Deviation (Population) | 8.7% | 10.5% |
Similar Demographics by Unemployment Among Women with Children Under 18 years
Demographics Similar to Canadians by Unemployment Among Women with Children Under 18 years
In terms of unemployment among women with children under 18 years, the demographic groups most similar to Canadians are Macedonian (5.3%, a difference of 0.060%), Immigrants from Europe (5.3%, a difference of 0.10%), Hungarian (5.3%, a difference of 0.13%), Basque (5.3%, a difference of 0.13%), and Kenyan (5.3%, a difference of 0.14%).
| Demographics | Rating | Rank | Unemployment Among Women with Children Under 18 years |
| Immigrants | Czechoslovakia | 88.9 /100 | #110 | Excellent 5.2% |
| French Canadians | 88.9 /100 | #111 | Excellent 5.2% |
| Immigrants | Eastern Europe | 88.5 /100 | #112 | Excellent 5.2% |
| French | 88.4 /100 | #113 | Excellent 5.2% |
| Kenyans | 88.2 /100 | #114 | Excellent 5.3% |
| Hungarians | 88.1 /100 | #115 | Excellent 5.3% |
| Macedonians | 87.7 /100 | #116 | Excellent 5.3% |
| Canadians | 87.4 /100 | #117 | Excellent 5.3% |
| Immigrants | Europe | 86.7 /100 | #118 | Excellent 5.3% |
| Basques | 86.5 /100 | #119 | Excellent 5.3% |
| Egyptians | 86.4 /100 | #120 | Excellent 5.3% |
| Immigrants | Romania | 85.8 /100 | #121 | Excellent 5.3% |
| Scotch-Irish | 85.7 /100 | #122 | Excellent 5.3% |
| Sudanese | 84.3 /100 | #123 | Excellent 5.3% |
| Native Hawaiians | 84.0 /100 | #124 | Excellent 5.3% |
Demographics Similar to Yup'ik by Unemployment Among Women with Children Under 18 years
In terms of unemployment among women with children under 18 years, the demographic groups most similar to Yup'ik are Pima (11.7%, a difference of 6.0%), Yuman (9.8%, a difference of 12.9%), Inupiat (9.6%, a difference of 15.1%), Arapaho (9.2%, a difference of 19.9%), and Puerto Rican (9.0%, a difference of 22.4%).
| Demographics | Rating | Rank | Unemployment Among Women with Children Under 18 years |
| Immigrants | Dominican Republic | 0.0 /100 | #333 | Tragic 7.5% |
| Cheyenne | 0.0 /100 | #334 | Tragic 7.8% |
| Apache | 0.0 /100 | #335 | Tragic 7.9% |
| Sioux | 0.0 /100 | #336 | Tragic 7.9% |
| Yakama | 0.0 /100 | #337 | Tragic 8.1% |
| Immigrants | Yemen | 0.0 /100 | #338 | Tragic 8.2% |
| Navajo | 0.0 /100 | #339 | Tragic 8.2% |
| Crow | 0.0 /100 | #340 | Tragic 8.2% |
| Tohono O'odham | 0.0 /100 | #341 | Tragic 8.9% |
| Puerto Ricans | 0.0 /100 | #342 | Tragic 9.0% |
| Arapaho | 0.0 /100 | #343 | Tragic 9.2% |
| Inupiat | 0.0 /100 | #344 | Tragic 9.6% |
| Yuman | 0.0 /100 | #345 | Tragic 9.8% |
| Yup'ik | 0.0 /100 | #346 | Tragic 11.0% |
| Pima | 0.0 /100 | #347 | Tragic 11.7% |