Canadian vs Yakama Child Poverty Under the Age of 16
COMPARE
Canadian
Yakama
Child Poverty Under the Age of 16
Child Poverty Under the Age of 16 Comparison
Canadians
Yakama
15.2%
CHILD POVERTY UNDER THE AGE OF 16
89.1/ 100
METRIC RATING
132nd/ 347
METRIC RANK
22.1%
CHILD POVERTY UNDER THE AGE OF 16
0.0/ 100
METRIC RATING
319th/ 347
METRIC RANK
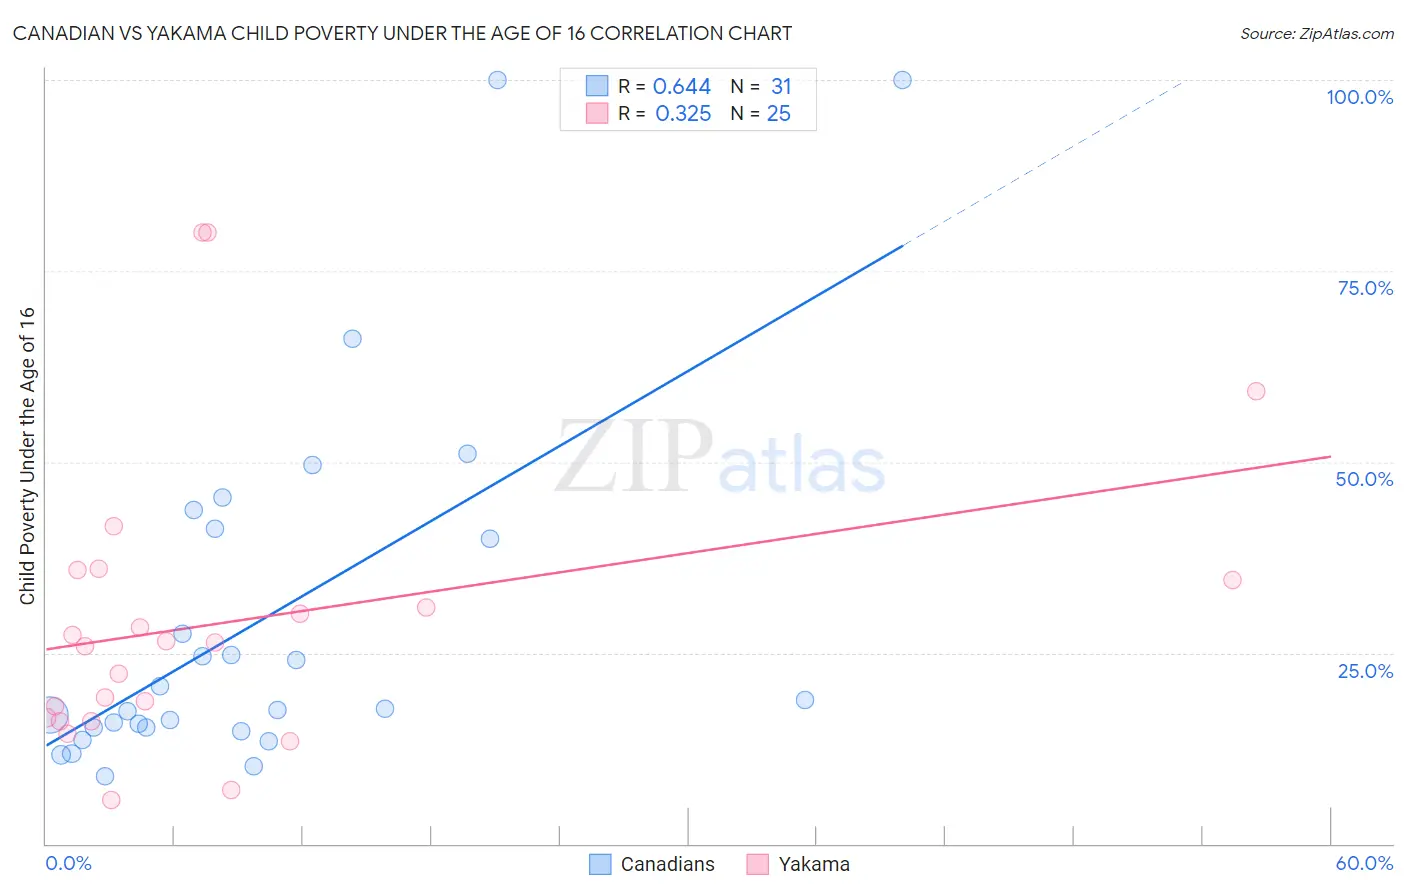
Canadian vs Yakama Child Poverty Under the Age of 16 Correlation Chart
The statistical analysis conducted on geographies consisting of 431,912,296 people shows a significant positive correlation between the proportion of Canadians and poverty level among children under the age of 16 in the United States with a correlation coefficient (R) of 0.644 and weighted average of 15.2%. Similarly, the statistical analysis conducted on geographies consisting of 19,893,282 people shows a mild positive correlation between the proportion of Yakama and poverty level among children under the age of 16 in the United States with a correlation coefficient (R) of 0.325 and weighted average of 22.1%, a difference of 45.4%.
Child Poverty Under the Age of 16 Correlation Summary
| Measurement | Canadian | Yakama |
| Minimum | 8.9% | 5.7% |
| Maximum | 100.0% | 80.0% |
| Range | 91.1% | 74.3% |
| Mean | 29.3% | 29.2% |
| Median | 17.7% | 26.3% |
| Interquartile 25% (IQ1) | 15.2% | 16.3% |
| Interquartile 75% (IQ3) | 41.2% | 35.2% |
| Interquartile Range (IQR) | 26.0% | 18.9% |
| Standard Deviation (Sample) | 23.7% | 19.1% |
| Standard Deviation (Population) | 23.3% | 18.7% |
Similar Demographics by Child Poverty Under the Age of 16
Demographics Similar to Canadians by Child Poverty Under the Age of 16
In terms of child poverty under the age of 16, the demographic groups most similar to Canadians are Immigrants from South Eastern Asia (15.2%, a difference of 0.050%), Armenian (15.2%, a difference of 0.090%), Mongolian (15.2%, a difference of 0.12%), Native Hawaiian (15.2%, a difference of 0.14%), and Albanian (15.2%, a difference of 0.18%).
| Demographics | Rating | Rank | Child Poverty Under the Age of 16 |
| Palestinians | 90.9 /100 | #125 | Exceptional 15.1% |
| Portuguese | 90.6 /100 | #126 | Exceptional 15.1% |
| Immigrants | Western Europe | 90.3 /100 | #127 | Exceptional 15.1% |
| Immigrants | Kazakhstan | 90.2 /100 | #128 | Exceptional 15.1% |
| Immigrants | Southern Europe | 89.7 /100 | #129 | Excellent 15.1% |
| Mongolians | 89.5 /100 | #130 | Excellent 15.2% |
| Armenians | 89.4 /100 | #131 | Excellent 15.2% |
| Canadians | 89.1 /100 | #132 | Excellent 15.2% |
| Immigrants | South Eastern Asia | 89.0 /100 | #133 | Excellent 15.2% |
| Native Hawaiians | 88.7 /100 | #134 | Excellent 15.2% |
| Albanians | 88.6 /100 | #135 | Excellent 15.2% |
| Immigrants | Spain | 87.3 /100 | #136 | Excellent 15.3% |
| Peruvians | 87.2 /100 | #137 | Excellent 15.3% |
| Welsh | 87.2 /100 | #138 | Excellent 15.3% |
| Immigrants | Vietnam | 87.1 /100 | #139 | Excellent 15.3% |
Demographics Similar to Yakama by Child Poverty Under the Age of 16
In terms of child poverty under the age of 16, the demographic groups most similar to Yakama are Cajun (22.1%, a difference of 0.20%), Kiowa (22.2%, a difference of 0.39%), U.S. Virgin Islander (22.0%, a difference of 0.51%), Honduran (22.2%, a difference of 0.58%), and Immigrants from Dominica (21.9%, a difference of 0.91%).
| Demographics | Rating | Rank | Child Poverty Under the Age of 16 |
| Ute | 0.0 /100 | #312 | Tragic 21.5% |
| Creek | 0.0 /100 | #313 | Tragic 21.5% |
| Immigrants | Somalia | 0.0 /100 | #314 | Tragic 21.6% |
| Immigrants | Guatemala | 0.0 /100 | #315 | Tragic 21.6% |
| Africans | 0.0 /100 | #316 | Tragic 21.7% |
| Immigrants | Dominica | 0.0 /100 | #317 | Tragic 21.9% |
| U.S. Virgin Islanders | 0.0 /100 | #318 | Tragic 22.0% |
| Yakama | 0.0 /100 | #319 | Tragic 22.1% |
| Cajuns | 0.0 /100 | #320 | Tragic 22.1% |
| Kiowa | 0.0 /100 | #321 | Tragic 22.2% |
| Hondurans | 0.0 /100 | #322 | Tragic 22.2% |
| Paiute | 0.0 /100 | #323 | Tragic 22.4% |
| Central American Indians | 0.0 /100 | #324 | Tragic 22.5% |
| Immigrants | Congo | 0.0 /100 | #325 | Tragic 22.5% |
| Immigrants | Honduras | 0.0 /100 | #326 | Tragic 22.7% |