Bolivian vs Immigrants from Latvia 2 or more Vehicles in Household
COMPARE
Bolivian
Immigrants from Latvia
2 or more Vehicles in Household
2 or more Vehicles in Household Comparison
Bolivians
Immigrants from Latvia
58.3%
2 OR MORE VEHICLES IN HOUSEHOLD
99.6/ 100
METRIC RATING
73rd/ 347
METRIC RANK
52.2%
2 OR MORE VEHICLES IN HOUSEHOLD
0.4/ 100
METRIC RATING
264th/ 347
METRIC RANK
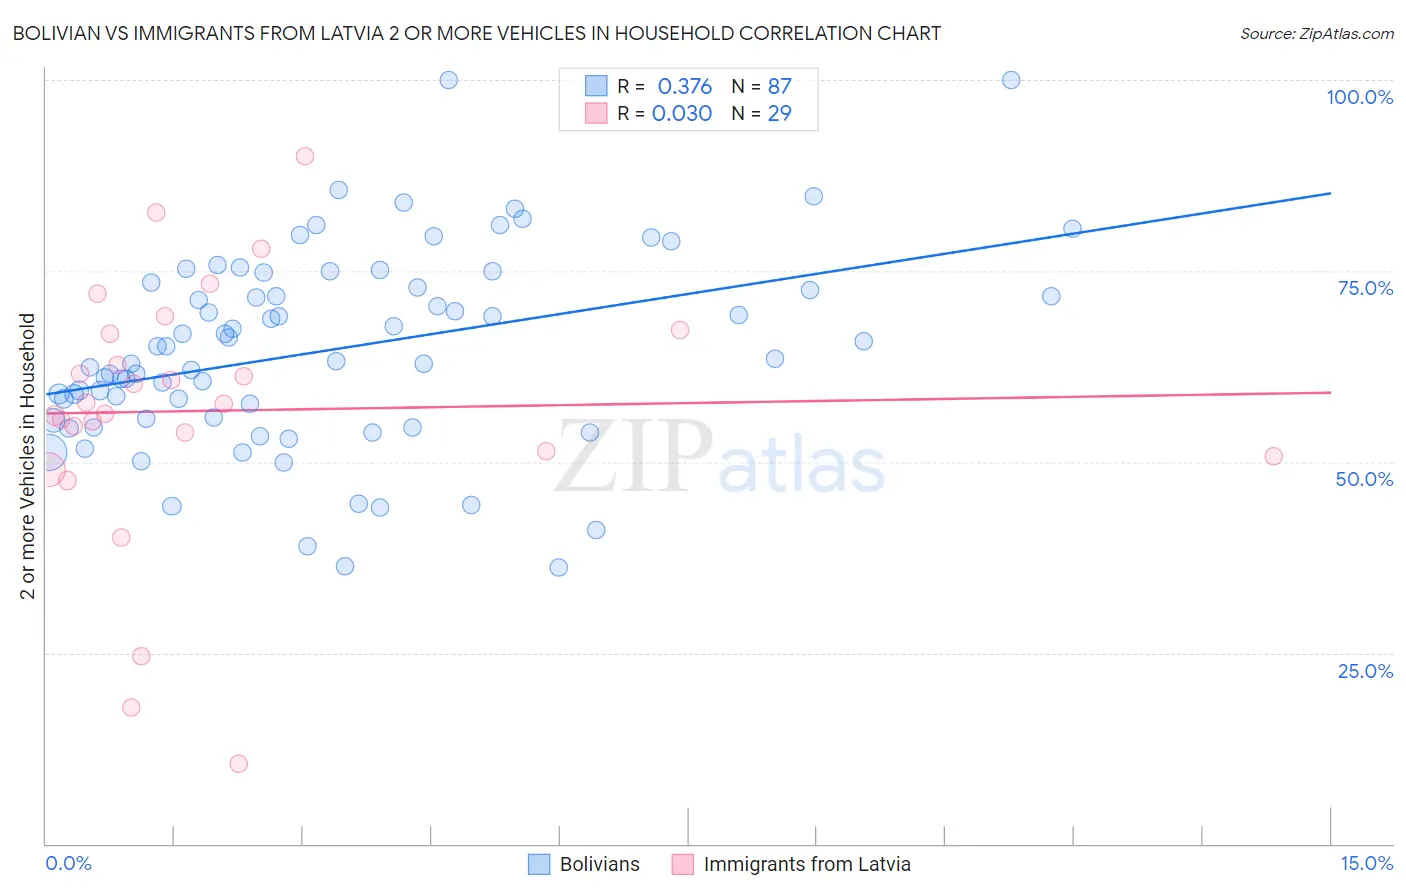
Bolivian vs Immigrants from Latvia 2 or more Vehicles in Household Correlation Chart
The statistical analysis conducted on geographies consisting of 184,629,947 people shows a mild positive correlation between the proportion of Bolivians and percentage of households with 2 or more vehicles available in the United States with a correlation coefficient (R) of 0.376 and weighted average of 58.3%. Similarly, the statistical analysis conducted on geographies consisting of 113,732,153 people shows no correlation between the proportion of Immigrants from Latvia and percentage of households with 2 or more vehicles available in the United States with a correlation coefficient (R) of 0.030 and weighted average of 52.2%, a difference of 11.7%.
2 or more Vehicles in Household Correlation Summary
| Measurement | Bolivian | Immigrants from Latvia |
| Minimum | 36.2% | 10.4% |
| Maximum | 100.0% | 89.9% |
| Range | 63.8% | 79.5% |
| Mean | 64.7% | 56.7% |
| Median | 63.5% | 57.6% |
| Interquartile 25% (IQ1) | 55.7% | 51.0% |
| Interquartile 75% (IQ3) | 73.5% | 67.1% |
| Interquartile Range (IQR) | 17.9% | 16.0% |
| Standard Deviation (Sample) | 12.9% | 17.3% |
| Standard Deviation (Population) | 12.8% | 17.0% |
Similar Demographics by 2 or more Vehicles in Household
Demographics Similar to Bolivians by 2 or more Vehicles in Household
In terms of 2 or more vehicles in household, the demographic groups most similar to Bolivians are Immigrants from Afghanistan (58.3%, a difference of 0.0%), Polish (58.3%, a difference of 0.080%), Austrian (58.4%, a difference of 0.12%), Creek (58.3%, a difference of 0.12%), and Slovene (58.3%, a difference of 0.12%).
| Demographics | Rating | Rank | 2 or more Vehicles in Household |
| Croatians | 99.7 /100 | #66 | Exceptional 58.6% |
| Laotians | 99.7 /100 | #67 | Exceptional 58.6% |
| Canadians | 99.7 /100 | #68 | Exceptional 58.6% |
| Pennsylvania Germans | 99.7 /100 | #69 | Exceptional 58.5% |
| Italians | 99.6 /100 | #70 | Exceptional 58.4% |
| Bangladeshis | 99.6 /100 | #71 | Exceptional 58.4% |
| Austrians | 99.6 /100 | #72 | Exceptional 58.4% |
| Bolivians | 99.6 /100 | #73 | Exceptional 58.3% |
| Immigrants | Afghanistan | 99.6 /100 | #74 | Exceptional 58.3% |
| Poles | 99.5 /100 | #75 | Exceptional 58.3% |
| Creek | 99.5 /100 | #76 | Exceptional 58.3% |
| Slovenes | 99.5 /100 | #77 | Exceptional 58.3% |
| Lithuanians | 99.5 /100 | #78 | Exceptional 58.2% |
| Delaware | 99.4 /100 | #79 | Exceptional 58.2% |
| Immigrants | England | 99.3 /100 | #80 | Exceptional 58.1% |
Demographics Similar to Immigrants from Latvia by 2 or more Vehicles in Household
In terms of 2 or more vehicles in household, the demographic groups most similar to Immigrants from Latvia are Immigrants from Southern Europe (52.3%, a difference of 0.040%), Immigrants from Northern Africa (52.3%, a difference of 0.17%), Immigrants from Congo (52.1%, a difference of 0.24%), Immigrants from Australia (52.4%, a difference of 0.37%), and Immigrants from France (52.0%, a difference of 0.39%).
| Demographics | Rating | Rank | 2 or more Vehicles in Household |
| Immigrants | Hong Kong | 0.6 /100 | #257 | Tragic 52.6% |
| Central American Indians | 0.6 /100 | #258 | Tragic 52.5% |
| Alsatians | 0.6 /100 | #259 | Tragic 52.5% |
| Immigrants | Bahamas | 0.5 /100 | #260 | Tragic 52.5% |
| Immigrants | Australia | 0.5 /100 | #261 | Tragic 52.4% |
| Immigrants | Northern Africa | 0.4 /100 | #262 | Tragic 52.3% |
| Immigrants | Southern Europe | 0.4 /100 | #263 | Tragic 52.3% |
| Immigrants | Latvia | 0.4 /100 | #264 | Tragic 52.2% |
| Immigrants | Congo | 0.3 /100 | #265 | Tragic 52.1% |
| Immigrants | France | 0.2 /100 | #266 | Tragic 52.0% |
| Immigrants | Colombia | 0.2 /100 | #267 | Tragic 52.0% |
| Pima | 0.2 /100 | #268 | Tragic 52.0% |
| Hondurans | 0.2 /100 | #269 | Tragic 52.0% |
| Immigrants | Ireland | 0.2 /100 | #270 | Tragic 52.0% |
| South Americans | 0.2 /100 | #271 | Tragic 51.9% |