Barbadian vs Yup'ik 4 or more Vehicles in Household
COMPARE
Barbadian
Yup'ik
4 or more Vehicles in Household
4 or more Vehicles in Household Comparison
Barbadians
Yup'ik
3.9%
4 OR MORE VEHICLES IN HOUSEHOLD
0.0/ 100
METRIC RATING
335th/ 347
METRIC RANK
5.7%
4 OR MORE VEHICLES IN HOUSEHOLD
1.5/ 100
METRIC RATING
255th/ 347
METRIC RANK
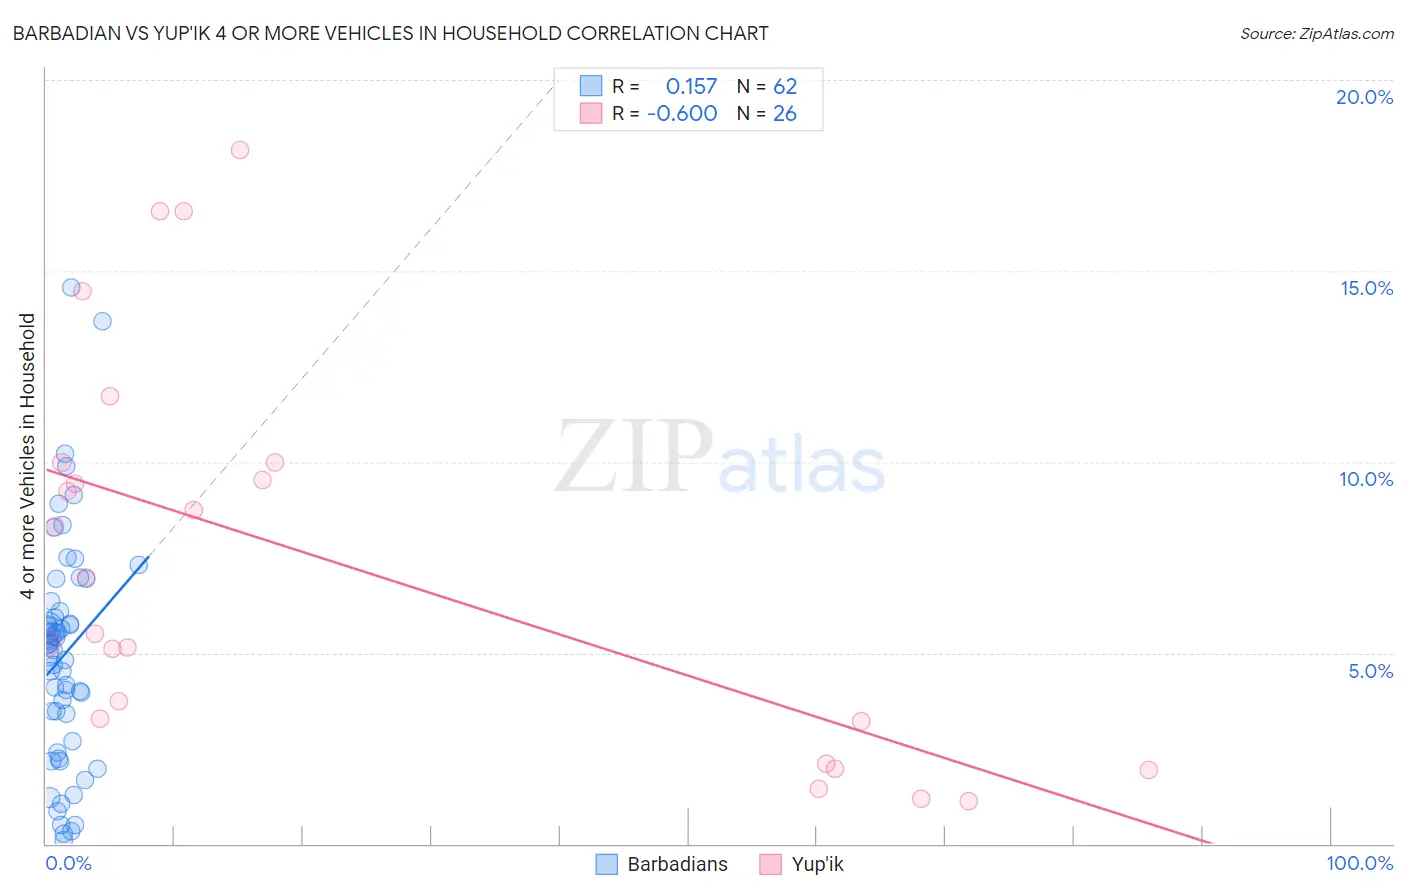
Barbadian vs Yup'ik 4 or more Vehicles in Household Correlation Chart
The statistical analysis conducted on geographies consisting of 140,490,439 people shows a poor positive correlation between the proportion of Barbadians and percentage of households with 4 or more vehicles available in the United States with a correlation coefficient (R) of 0.157 and weighted average of 3.9%. Similarly, the statistical analysis conducted on geographies consisting of 39,858,552 people shows a significant negative correlation between the proportion of Yup'ik and percentage of households with 4 or more vehicles available in the United States with a correlation coefficient (R) of -0.600 and weighted average of 5.7%, a difference of 44.8%.
4 or more Vehicles in Household Correlation Summary
| Measurement | Barbadian | Yup'ik |
| Minimum | 0.11% | 1.1% |
| Maximum | 14.6% | 18.2% |
| Range | 14.5% | 17.1% |
| Mean | 4.9% | 7.3% |
| Median | 5.1% | 6.2% |
| Interquartile 25% (IQ1) | 2.7% | 3.2% |
| Interquartile 75% (IQ3) | 6.1% | 10.0% |
| Interquartile Range (IQR) | 3.4% | 6.8% |
| Standard Deviation (Sample) | 3.0% | 5.1% |
| Standard Deviation (Population) | 3.0% | 5.0% |
Similar Demographics by 4 or more Vehicles in Household
Demographics Similar to Barbadians by 4 or more Vehicles in Household
In terms of 4 or more vehicles in household, the demographic groups most similar to Barbadians are Immigrants from Bangladesh (3.9%, a difference of 0.18%), Vietnamese (3.9%, a difference of 0.69%), Immigrants from Cabo Verde (3.8%, a difference of 2.5%), Immigrants from Trinidad and Tobago (4.1%, a difference of 5.2%), and Immigrants from Albania (4.1%, a difference of 5.4%).
| Demographics | Rating | Rank | 4 or more Vehicles in Household |
| Trinidadians and Tobagonians | 0.0 /100 | #328 | Tragic 4.3% |
| Immigrants | Senegal | 0.0 /100 | #329 | Tragic 4.2% |
| Immigrants | Ecuador | 0.0 /100 | #330 | Tragic 4.2% |
| West Indians | 0.0 /100 | #331 | Tragic 4.2% |
| Immigrants | Dominica | 0.0 /100 | #332 | Tragic 4.2% |
| Immigrants | Albania | 0.0 /100 | #333 | Tragic 4.1% |
| Immigrants | Trinidad and Tobago | 0.0 /100 | #334 | Tragic 4.1% |
| Barbadians | 0.0 /100 | #335 | Tragic 3.9% |
| Immigrants | Bangladesh | 0.0 /100 | #336 | Tragic 3.9% |
| Vietnamese | 0.0 /100 | #337 | Tragic 3.9% |
| Immigrants | Cabo Verde | 0.0 /100 | #338 | Tragic 3.8% |
| Immigrants | Uzbekistan | 0.0 /100 | #339 | Tragic 3.6% |
| Immigrants | Barbados | 0.0 /100 | #340 | Tragic 3.6% |
| Dominicans | 0.0 /100 | #341 | Tragic 3.5% |
| Guyanese | 0.0 /100 | #342 | Tragic 3.5% |
Demographics Similar to Yup'ik by 4 or more Vehicles in Household
In terms of 4 or more vehicles in household, the demographic groups most similar to Yup'ik are Immigrants from Turkey (5.7%, a difference of 0.040%), Immigrants from Panama (5.7%, a difference of 0.090%), Immigrants from Northern Africa (5.6%, a difference of 0.12%), Immigrants from Cuba (5.7%, a difference of 0.22%), and Immigrants from Lithuania (5.6%, a difference of 0.25%).
| Demographics | Rating | Rank | 4 or more Vehicles in Household |
| Immigrants | Eastern Africa | 2.4 /100 | #248 | Tragic 5.7% |
| Immigrants | Southern Europe | 2.3 /100 | #249 | Tragic 5.7% |
| Immigrants | Europe | 2.3 /100 | #250 | Tragic 5.7% |
| Ugandans | 2.2 /100 | #251 | Tragic 5.7% |
| Sub-Saharan Africans | 2.1 /100 | #252 | Tragic 5.7% |
| Immigrants | Cuba | 1.6 /100 | #253 | Tragic 5.7% |
| Immigrants | Panama | 1.5 /100 | #254 | Tragic 5.7% |
| Yup'ik | 1.5 /100 | #255 | Tragic 5.7% |
| Immigrants | Turkey | 1.5 /100 | #256 | Tragic 5.7% |
| Immigrants | Northern Africa | 1.4 /100 | #257 | Tragic 5.6% |
| Immigrants | Lithuania | 1.4 /100 | #258 | Tragic 5.6% |
| Immigrants | France | 1.3 /100 | #259 | Tragic 5.6% |
| Uruguayans | 1.3 /100 | #260 | Tragic 5.6% |
| Sudanese | 1.2 /100 | #261 | Tragic 5.6% |
| Bermudans | 1.2 /100 | #262 | Tragic 5.6% |