Barbadian vs Immigrants from Cabo Verde 1 or more Vehicles in Household
COMPARE
Barbadian
Immigrants from Cabo Verde
1 or more Vehicles in Household
1 or more Vehicles in Household Comparison
Barbadians
Immigrants from Cabo Verde
74.0%
1 OR MORE VEHICLES IN HOUSEHOLD
0.0/ 100
METRIC RATING
335th/ 347
METRIC RANK
81.6%
1 OR MORE VEHICLES IN HOUSEHOLD
0.0/ 100
METRIC RATING
322nd/ 347
METRIC RANK
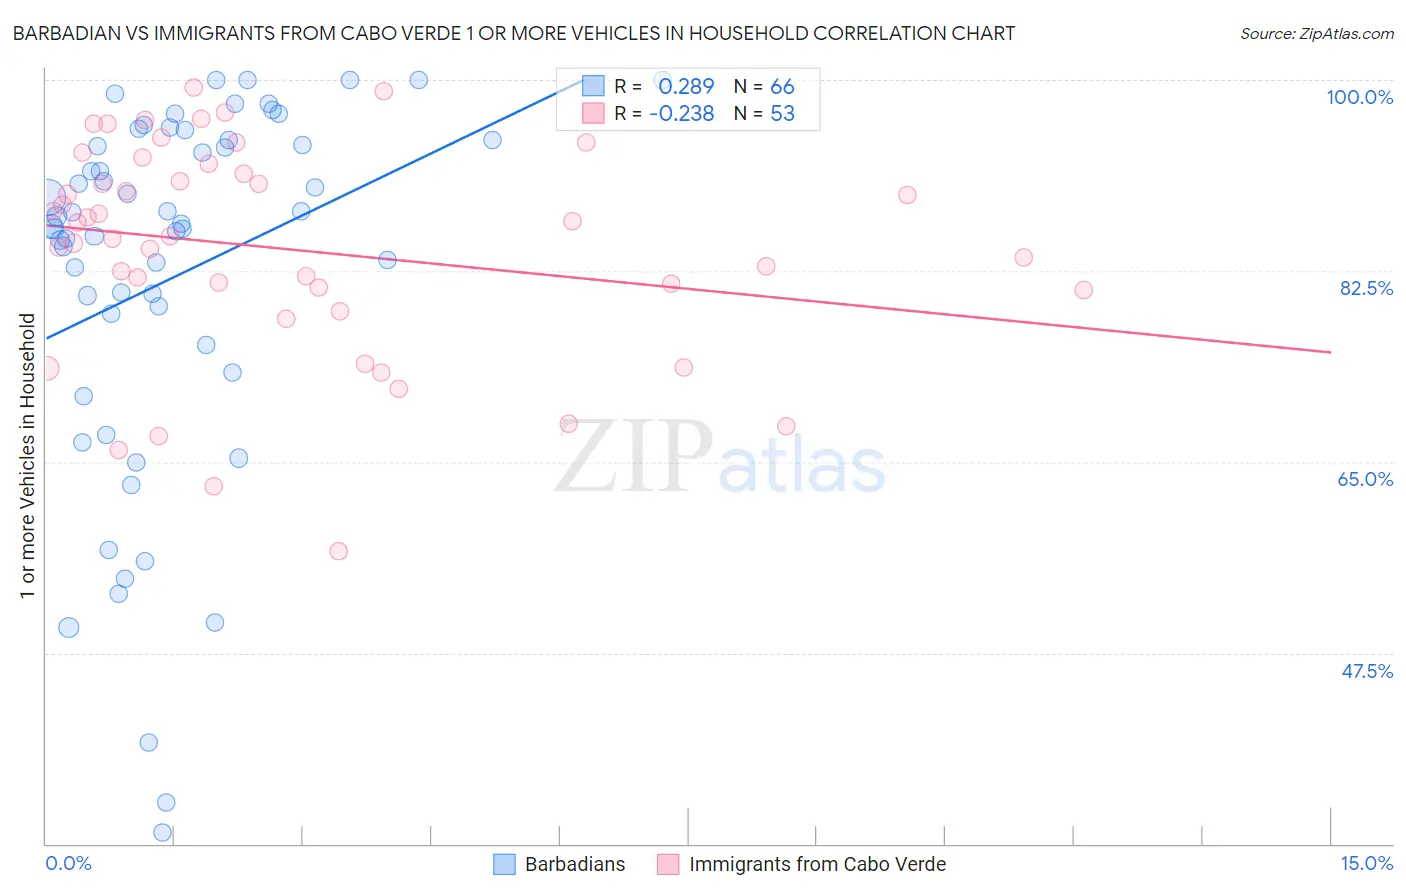
Barbadian vs Immigrants from Cabo Verde 1 or more Vehicles in Household Correlation Chart
The statistical analysis conducted on geographies consisting of 141,288,849 people shows a weak positive correlation between the proportion of Barbadians and percentage of households with 1 or more vehicles available in the United States with a correlation coefficient (R) of 0.289 and weighted average of 74.0%. Similarly, the statistical analysis conducted on geographies consisting of 38,145,332 people shows a weak negative correlation between the proportion of Immigrants from Cabo Verde and percentage of households with 1 or more vehicles available in the United States with a correlation coefficient (R) of -0.238 and weighted average of 81.6%, a difference of 10.3%.
1 or more Vehicles in Household Correlation Summary
| Measurement | Barbadian | Immigrants from Cabo Verde |
| Minimum | 31.0% | 56.8% |
| Maximum | 100.0% | 99.3% |
| Range | 69.0% | 42.5% |
| Mean | 82.0% | 84.4% |
| Median | 86.7% | 85.7% |
| Interquartile 25% (IQ1) | 75.7% | 79.8% |
| Interquartile 75% (IQ3) | 94.5% | 91.9% |
| Interquartile Range (IQR) | 18.8% | 12.1% |
| Standard Deviation (Sample) | 17.0% | 9.9% |
| Standard Deviation (Population) | 16.9% | 9.8% |
Demographics Similar to Barbadians and Immigrants from Cabo Verde by 1 or more Vehicles in Household
In terms of 1 or more vehicles in household, the demographic groups most similar to Barbadians are Vietnamese (73.8%, a difference of 0.21%), Immigrants from Bangladesh (74.3%, a difference of 0.44%), Immigrants from Uzbekistan (73.4%, a difference of 0.82%), Immigrants from Ecuador (76.2%, a difference of 3.0%), and Trinidadian and Tobagonian (76.3%, a difference of 3.2%). Similarly, the demographic groups most similar to Immigrants from Cabo Verde are Jamaican (82.1%, a difference of 0.67%), Soviet Union (82.7%, a difference of 1.3%), Immigrants from Yemen (80.5%, a difference of 1.3%), Immigrants from Caribbean (80.4%, a difference of 1.4%), and Senegalese (80.4%, a difference of 1.5%).
| Demographics | Rating | Rank | 1 or more Vehicles in Household |
| Immigrants | Ghana | 0.0 /100 | #318 | Tragic 83.4% |
| Immigrants | Belarus | 0.0 /100 | #319 | Tragic 83.3% |
| Soviet Union | 0.0 /100 | #320 | Tragic 82.7% |
| Jamaicans | 0.0 /100 | #321 | Tragic 82.1% |
| Immigrants | Cabo Verde | 0.0 /100 | #322 | Tragic 81.6% |
| Immigrants | Yemen | 0.0 /100 | #323 | Tragic 80.5% |
| Immigrants | Caribbean | 0.0 /100 | #324 | Tragic 80.4% |
| Senegalese | 0.0 /100 | #325 | Tragic 80.4% |
| Immigrants | West Indies | 0.0 /100 | #326 | Tragic 79.5% |
| Immigrants | Senegal | 0.0 /100 | #327 | Tragic 79.0% |
| Ecuadorians | 0.0 /100 | #328 | Tragic 77.9% |
| Immigrants | Dominica | 0.0 /100 | #329 | Tragic 77.8% |
| Immigrants | Trinidad and Tobago | 0.0 /100 | #330 | Tragic 76.8% |
| West Indians | 0.0 /100 | #331 | Tragic 76.4% |
| Trinidadians and Tobagonians | 0.0 /100 | #332 | Tragic 76.3% |
| Immigrants | Ecuador | 0.0 /100 | #333 | Tragic 76.2% |
| Immigrants | Bangladesh | 0.0 /100 | #334 | Tragic 74.3% |
| Barbadians | 0.0 /100 | #335 | Tragic 74.0% |
| Vietnamese | 0.0 /100 | #336 | Tragic 73.8% |
| Immigrants | Uzbekistan | 0.0 /100 | #337 | Tragic 73.4% |
| Inupiat | 0.0 /100 | #338 | Tragic 71.5% |