Asian vs Choctaw Divorced or Separated
COMPARE
Asian
Choctaw
Divorced or Separated
Divorced or Separated Comparison
Asians
Choctaw
10.6%
DIVORCED OR SEPARATED
100.0/ 100
METRIC RATING
19th/ 347
METRIC RANK
14.1%
DIVORCED OR SEPARATED
0.0/ 100
METRIC RATING
338th/ 347
METRIC RANK
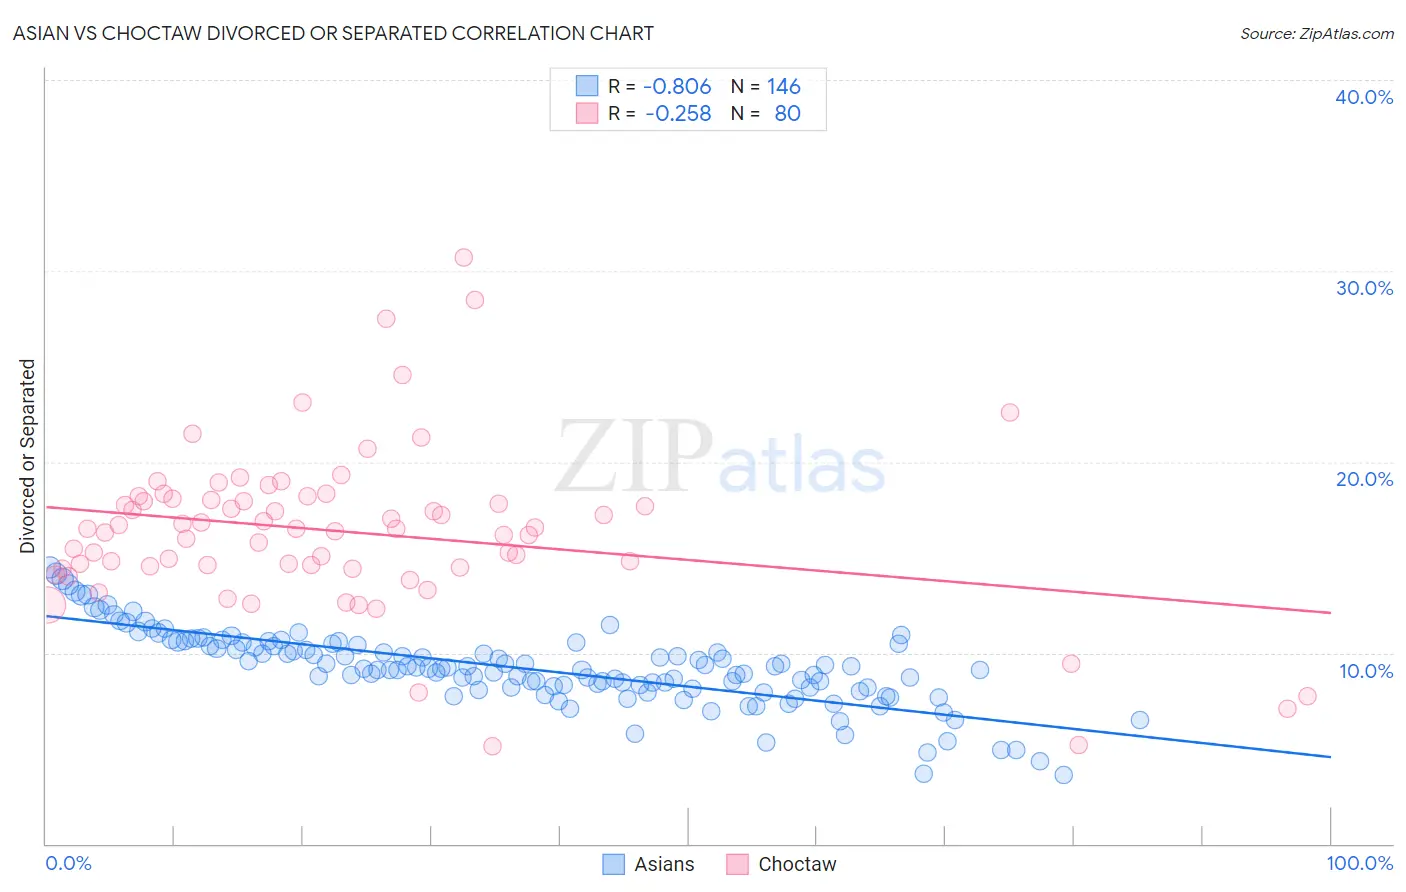
Asian vs Choctaw Divorced or Separated Correlation Chart
The statistical analysis conducted on geographies consisting of 550,451,547 people shows a very strong negative correlation between the proportion of Asians and percentage of population currently divorced or separated in the United States with a correlation coefficient (R) of -0.806 and weighted average of 10.6%. Similarly, the statistical analysis conducted on geographies consisting of 269,698,992 people shows a weak negative correlation between the proportion of Choctaw and percentage of population currently divorced or separated in the United States with a correlation coefficient (R) of -0.258 and weighted average of 14.1%, a difference of 32.8%.
Divorced or Separated Correlation Summary
| Measurement | Asian | Choctaw |
| Minimum | 3.6% | 5.1% |
| Maximum | 14.5% | 30.7% |
| Range | 10.9% | 25.6% |
| Mean | 9.2% | 16.3% |
| Median | 9.2% | 16.5% |
| Interquartile 25% (IQ1) | 8.2% | 14.5% |
| Interquartile 75% (IQ3) | 10.5% | 18.0% |
| Interquartile Range (IQR) | 2.3% | 3.5% |
| Standard Deviation (Sample) | 2.0% | 4.3% |
| Standard Deviation (Population) | 2.0% | 4.3% |
Similar Demographics by Divorced or Separated
Demographics Similar to Asians by Divorced or Separated
In terms of divorced or separated, the demographic groups most similar to Asians are Immigrants from Iran (10.6%, a difference of 0.0%), Immigrants from Israel (10.6%, a difference of 0.090%), Immigrants from Korea (10.6%, a difference of 0.20%), Immigrants from Armenia (10.6%, a difference of 0.64%), and Assyrian/Chaldean/Syriac (10.6%, a difference of 0.71%).
| Demographics | Rating | Rank | Divorced or Separated |
| Okinawans | 100.0 /100 | #12 | Exceptional 10.5% |
| Cypriots | 100.0 /100 | #13 | Exceptional 10.5% |
| Assyrians/Chaldeans/Syriacs | 100.0 /100 | #14 | Exceptional 10.6% |
| Immigrants | Armenia | 100.0 /100 | #15 | Exceptional 10.6% |
| Immigrants | Korea | 100.0 /100 | #16 | Exceptional 10.6% |
| Immigrants | Israel | 100.0 /100 | #17 | Exceptional 10.6% |
| Immigrants | Iran | 100.0 /100 | #18 | Exceptional 10.6% |
| Asians | 100.0 /100 | #19 | Exceptional 10.6% |
| Burmese | 100.0 /100 | #20 | Exceptional 10.7% |
| Immigrants | Asia | 100.0 /100 | #21 | Exceptional 10.7% |
| Vietnamese | 100.0 /100 | #22 | Exceptional 10.8% |
| Immigrants | Pakistan | 100.0 /100 | #23 | Exceptional 10.8% |
| Immigrants | Sri Lanka | 100.0 /100 | #24 | Exceptional 10.8% |
| Iranians | 100.0 /100 | #25 | Exceptional 10.8% |
| Immigrants | Indonesia | 100.0 /100 | #26 | Exceptional 10.9% |
Demographics Similar to Choctaw by Divorced or Separated
In terms of divorced or separated, the demographic groups most similar to Choctaw are Crow (14.1%, a difference of 0.31%), Colville (14.2%, a difference of 0.53%), Chickasaw (14.2%, a difference of 0.57%), Shoshone (14.0%, a difference of 0.60%), and Bahamian (14.2%, a difference of 0.77%).
| Demographics | Rating | Rank | Divorced or Separated |
| Blacks/African Americans | 0.0 /100 | #331 | Tragic 13.6% |
| Cherokee | 0.0 /100 | #332 | Tragic 13.7% |
| Puerto Ricans | 0.0 /100 | #333 | Tragic 13.9% |
| Immigrants | Bahamas | 0.0 /100 | #334 | Tragic 13.9% |
| Dutch West Indians | 0.0 /100 | #335 | Tragic 14.0% |
| Shoshone | 0.0 /100 | #336 | Tragic 14.0% |
| Crow | 0.0 /100 | #337 | Tragic 14.1% |
| Choctaw | 0.0 /100 | #338 | Tragic 14.1% |
| Colville | 0.0 /100 | #339 | Tragic 14.2% |
| Chickasaw | 0.0 /100 | #340 | Tragic 14.2% |
| Bahamians | 0.0 /100 | #341 | Tragic 14.2% |
| Seminole | 0.0 /100 | #342 | Tragic 14.3% |
| Creek | 0.0 /100 | #343 | Tragic 14.4% |
| Cubans | 0.0 /100 | #344 | Tragic 14.5% |
| Kiowa | 0.0 /100 | #345 | Tragic 14.5% |