Argentinean vs Immigrants from Uruguay In Labor Force | Age 35-44
COMPARE
Argentinean
Immigrants from Uruguay
In Labor Force | Age 35-44
In Labor Force | Age 35-44 Comparison
Argentineans
Immigrants from Uruguay
84.6%
IN LABOR FORCE | AGE 35-44
88.4/ 100
METRIC RATING
133rd/ 347
METRIC RANK
84.6%
IN LABOR FORCE | AGE 35-44
80.1/ 100
METRIC RATING
142nd/ 347
METRIC RANK
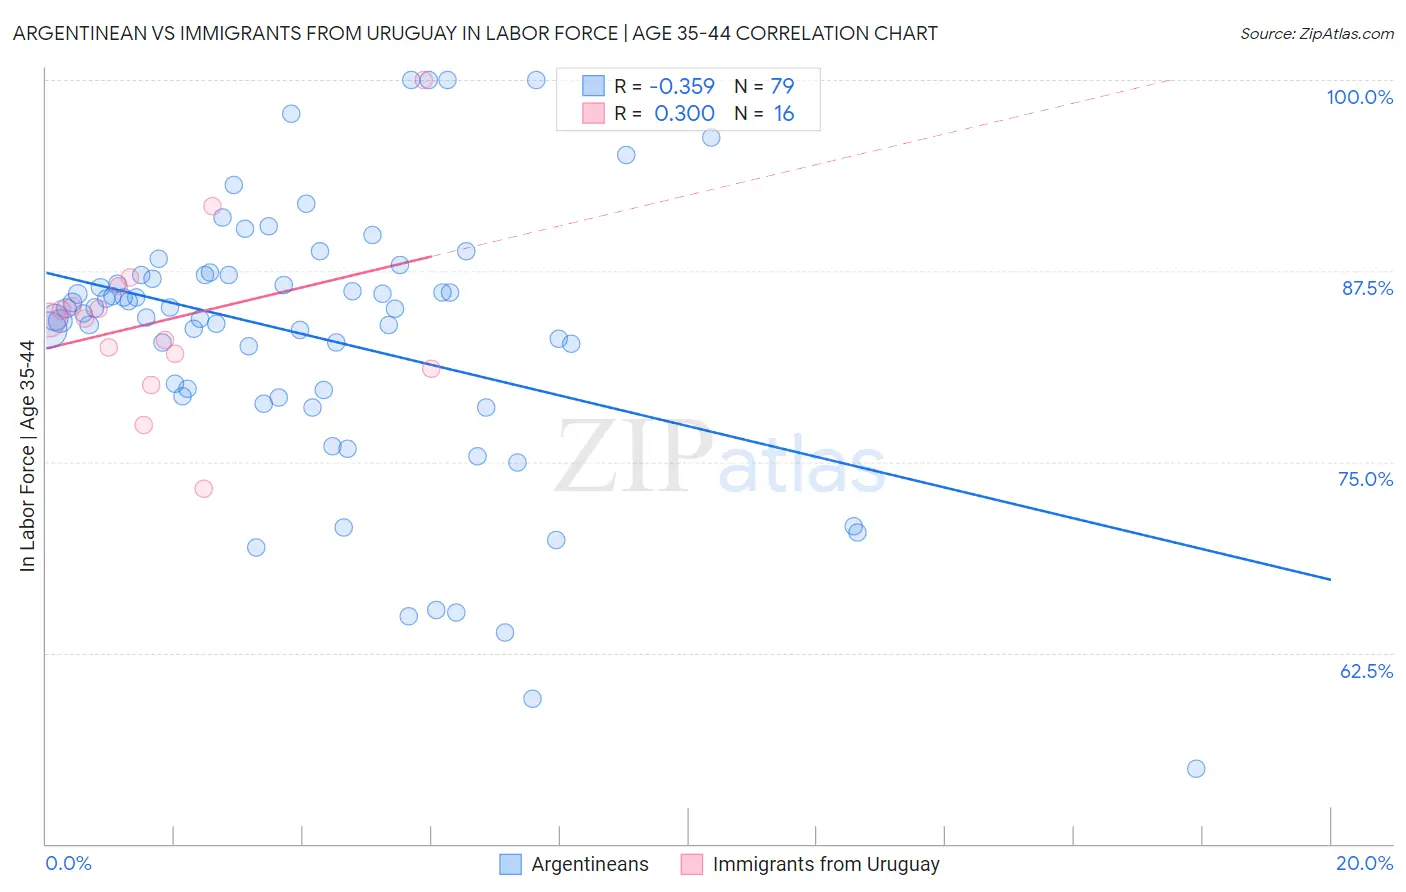
Argentinean vs Immigrants from Uruguay In Labor Force | Age 35-44 Correlation Chart
The statistical analysis conducted on geographies consisting of 297,032,479 people shows a mild negative correlation between the proportion of Argentineans and labor force participation rate among population between the ages 35 and 44 in the United States with a correlation coefficient (R) of -0.359 and weighted average of 84.6%. Similarly, the statistical analysis conducted on geographies consisting of 133,247,562 people shows a weak positive correlation between the proportion of Immigrants from Uruguay and labor force participation rate among population between the ages 35 and 44 in the United States with a correlation coefficient (R) of 0.300 and weighted average of 84.6%, a difference of 0.10%.
In Labor Force | Age 35-44 Correlation Summary
| Measurement | Argentinean | Immigrants from Uruguay |
| Minimum | 54.9% | 73.2% |
| Maximum | 100.0% | 100.0% |
| Range | 45.1% | 26.8% |
| Mean | 83.2% | 84.3% |
| Median | 85.0% | 84.3% |
| Interquartile 25% (IQ1) | 79.3% | 81.6% |
| Interquartile 75% (IQ3) | 87.2% | 85.8% |
| Interquartile Range (IQR) | 8.0% | 4.3% |
| Standard Deviation (Sample) | 9.0% | 5.9% |
| Standard Deviation (Population) | 8.9% | 5.7% |
Demographics Similar to Argentineans and Immigrants from Uruguay by In Labor Force | Age 35-44
In terms of in labor force | age 35-44, the demographic groups most similar to Argentineans are Immigrants from Korea (84.6%, a difference of 0.0%), Immigrants from Malaysia (84.6%, a difference of 0.010%), Palestinian (84.7%, a difference of 0.020%), Bhutanese (84.7%, a difference of 0.020%), and Immigrants from Scotland (84.7%, a difference of 0.020%). Similarly, the demographic groups most similar to Immigrants from Uruguay are Immigrants from Ukraine (84.6%, a difference of 0.0%), Immigrants from Japan (84.6%, a difference of 0.010%), Immigrants from Belgium (84.6%, a difference of 0.010%), Immigrants from Jamaica (84.6%, a difference of 0.010%), and Immigrants from Saudi Arabia (84.6%, a difference of 0.010%).
| Demographics | Rating | Rank | In Labor Force | Age 35-44 |
| Immigrants | Spain | 90.6 /100 | #127 | Exceptional 84.7% |
| Immigrants | Ghana | 90.4 /100 | #128 | Exceptional 84.7% |
| Palestinians | 89.7 /100 | #129 | Excellent 84.7% |
| Bhutanese | 89.7 /100 | #130 | Excellent 84.7% |
| Immigrants | Scotland | 89.6 /100 | #131 | Excellent 84.7% |
| Austrians | 89.4 /100 | #132 | Excellent 84.7% |
| Argentineans | 88.4 /100 | #133 | Excellent 84.6% |
| Immigrants | Korea | 88.2 /100 | #134 | Excellent 84.6% |
| Immigrants | Malaysia | 87.5 /100 | #135 | Excellent 84.6% |
| Afghans | 86.3 /100 | #136 | Excellent 84.6% |
| Immigrants | Chile | 84.6 /100 | #137 | Excellent 84.6% |
| Czechoslovakians | 82.6 /100 | #138 | Excellent 84.6% |
| Immigrants | Zaire | 82.5 /100 | #139 | Excellent 84.6% |
| Immigrants | Japan | 81.4 /100 | #140 | Excellent 84.6% |
| Immigrants | Belgium | 80.8 /100 | #141 | Excellent 84.6% |
| Immigrants | Uruguay | 80.1 /100 | #142 | Excellent 84.6% |
| Immigrants | Ukraine | 79.7 /100 | #143 | Good 84.6% |
| Immigrants | Jamaica | 79.4 /100 | #144 | Good 84.6% |
| Immigrants | Saudi Arabia | 79.4 /100 | #145 | Good 84.6% |
| Immigrants | Asia | 78.7 /100 | #146 | Good 84.5% |
| Immigrants | Netherlands | 76.6 /100 | #147 | Good 84.5% |