Burmese vs Immigrants from Uruguay 1 or more Vehicles in Household
COMPARE
Burmese
Immigrants from Uruguay
1 or more Vehicles in Household
1 or more Vehicles in Household Comparison
Burmese
Immigrants from Uruguay
90.4%
1 OR MORE VEHICLES IN HOUSEHOLD
89.0/ 100
METRIC RATING
128th/ 347
METRIC RANK
88.1%
1 OR MORE VEHICLES IN HOUSEHOLD
1.1/ 100
METRIC RATING
252nd/ 347
METRIC RANK
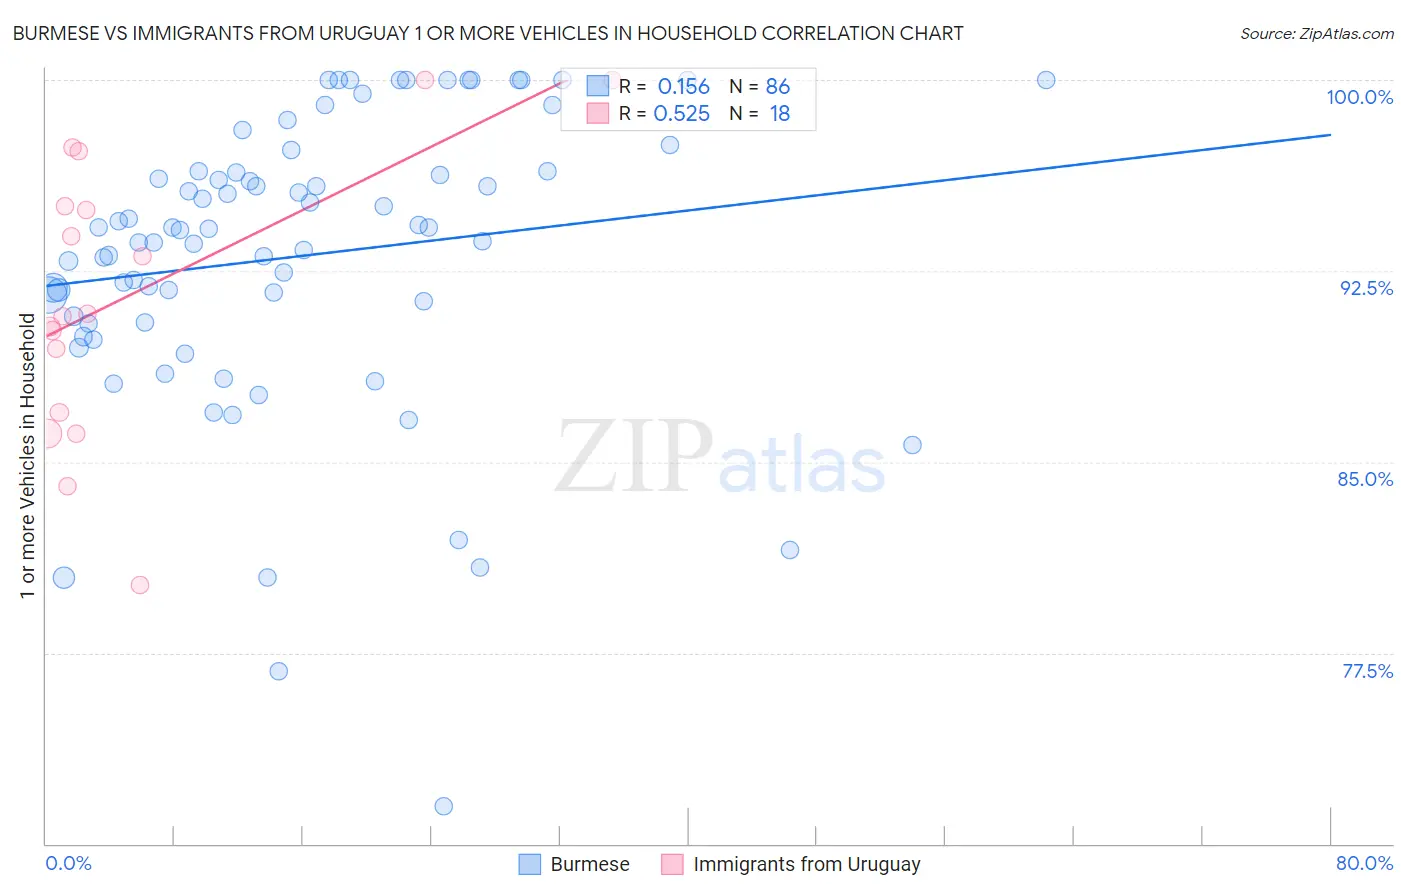
Burmese vs Immigrants from Uruguay 1 or more Vehicles in Household Correlation Chart
The statistical analysis conducted on geographies consisting of 464,980,772 people shows a poor positive correlation between the proportion of Burmese and percentage of households with 1 or more vehicles available in the United States with a correlation coefficient (R) of 0.156 and weighted average of 90.4%. Similarly, the statistical analysis conducted on geographies consisting of 133,245,142 people shows a substantial positive correlation between the proportion of Immigrants from Uruguay and percentage of households with 1 or more vehicles available in the United States with a correlation coefficient (R) of 0.525 and weighted average of 88.1%, a difference of 2.6%.
1 or more Vehicles in Household Correlation Summary
| Measurement | Burmese | Immigrants from Uruguay |
| Minimum | 71.5% | 80.2% |
| Maximum | 100.0% | 100.0% |
| Range | 28.5% | 19.8% |
| Mean | 93.1% | 91.5% |
| Median | 94.1% | 90.8% |
| Interquartile 25% (IQ1) | 90.5% | 87.0% |
| Interquartile 75% (IQ3) | 96.4% | 95.0% |
| Interquartile Range (IQR) | 5.9% | 8.1% |
| Standard Deviation (Sample) | 5.7% | 5.5% |
| Standard Deviation (Population) | 5.7% | 5.3% |
Similar Demographics by 1 or more Vehicles in Household
Demographics Similar to Burmese by 1 or more Vehicles in Household
In terms of 1 or more vehicles in household, the demographic groups most similar to Burmese are Immigrants from the Azores (90.4%, a difference of 0.0%), Immigrants from Cameroon (90.4%, a difference of 0.010%), Marshallese (90.4%, a difference of 0.010%), Nicaraguan (90.4%, a difference of 0.010%), and Immigrants from Kenya (90.4%, a difference of 0.020%).
| Demographics | Rating | Rank | 1 or more Vehicles in Household |
| Icelanders | 92.1 /100 | #121 | Exceptional 90.5% |
| Costa Ricans | 92.0 /100 | #122 | Exceptional 90.5% |
| Fijians | 91.8 /100 | #123 | Exceptional 90.5% |
| Puget Sound Salish | 91.5 /100 | #124 | Exceptional 90.5% |
| Immigrants | Korea | 90.5 /100 | #125 | Exceptional 90.5% |
| Immigrants | Cameroon | 89.4 /100 | #126 | Excellent 90.4% |
| Immigrants | Azores | 89.1 /100 | #127 | Excellent 90.4% |
| Burmese | 89.0 /100 | #128 | Excellent 90.4% |
| Marshallese | 88.9 /100 | #129 | Excellent 90.4% |
| Nicaraguans | 88.8 /100 | #130 | Excellent 90.4% |
| Immigrants | Kenya | 88.5 /100 | #131 | Excellent 90.4% |
| Immigrants | South Africa | 88.1 /100 | #132 | Excellent 90.4% |
| Immigrants | Syria | 87.5 /100 | #133 | Excellent 90.4% |
| Kenyans | 87.0 /100 | #134 | Excellent 90.4% |
| Immigrants | Oceania | 86.9 /100 | #135 | Excellent 90.4% |
Demographics Similar to Immigrants from Uruguay by 1 or more Vehicles in Household
In terms of 1 or more vehicles in household, the demographic groups most similar to Immigrants from Uruguay are Honduran (88.1%, a difference of 0.030%), Haitian (88.1%, a difference of 0.040%), Immigrants from Serbia (88.2%, a difference of 0.050%), Egyptian (88.2%, a difference of 0.060%), and Immigrants from Latvia (88.1%, a difference of 0.060%).
| Demographics | Rating | Rank | 1 or more Vehicles in Household |
| Immigrants | Czechoslovakia | 1.9 /100 | #245 | Tragic 88.3% |
| Menominee | 1.9 /100 | #246 | Tragic 88.3% |
| Immigrants | Honduras | 1.7 /100 | #247 | Tragic 88.3% |
| Immigrants | Nigeria | 1.5 /100 | #248 | Tragic 88.2% |
| Blacks/African Americans | 1.4 /100 | #249 | Tragic 88.2% |
| Egyptians | 1.2 /100 | #250 | Tragic 88.2% |
| Immigrants | Serbia | 1.2 /100 | #251 | Tragic 88.2% |
| Immigrants | Uruguay | 1.1 /100 | #252 | Tragic 88.1% |
| Hondurans | 1.0 /100 | #253 | Tragic 88.1% |
| Haitians | 0.9 /100 | #254 | Tragic 88.1% |
| Immigrants | Latvia | 0.9 /100 | #255 | Tragic 88.1% |
| Colombians | 0.9 /100 | #256 | Tragic 88.0% |
| Liberians | 0.9 /100 | #257 | Tragic 88.0% |
| South American Indians | 0.9 /100 | #258 | Tragic 88.0% |
| Nigerians | 0.8 /100 | #259 | Tragic 88.0% |