Arab vs Immigrants from Austria No Vehicles in Household
COMPARE
Arab
Immigrants from Austria
No Vehicles in Household
No Vehicles in Household Comparison
Arabs
Immigrants from Austria
10.5%
NO VEHICLES IN HOUSEHOLD
45.3/ 100
METRIC RATING
180th/ 347
METRIC RANK
10.2%
NO VEHICLES IN HOUSEHOLD
64.4/ 100
METRIC RATING
162nd/ 347
METRIC RANK
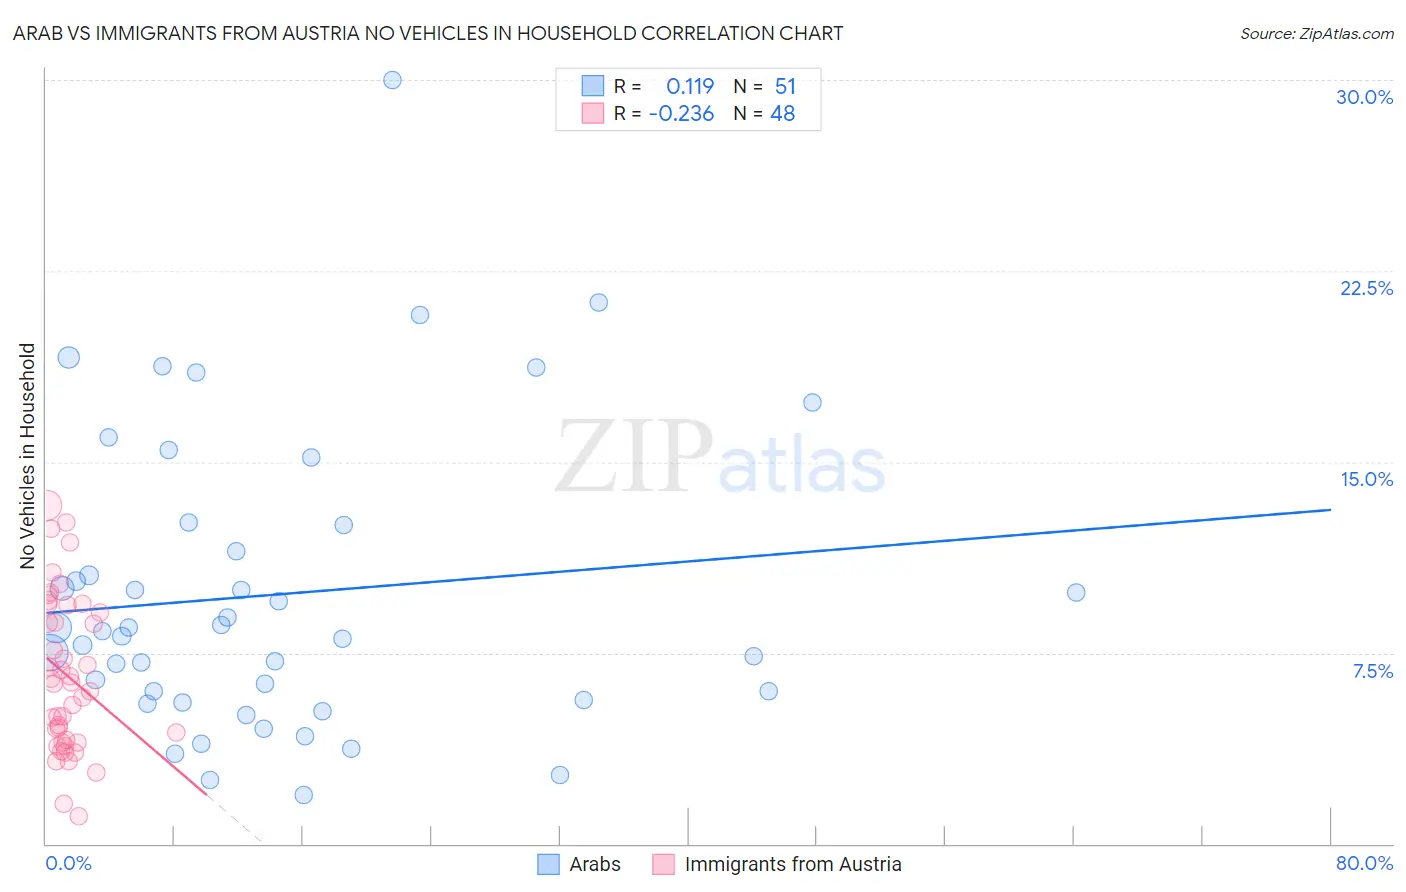
Arab vs Immigrants from Austria No Vehicles in Household Correlation Chart
The statistical analysis conducted on geographies consisting of 484,728,564 people shows a poor positive correlation between the proportion of Arabs and percentage of households with no vehicle available in the United States with a correlation coefficient (R) of 0.119 and weighted average of 10.5%. Similarly, the statistical analysis conducted on geographies consisting of 167,824,627 people shows a weak negative correlation between the proportion of Immigrants from Austria and percentage of households with no vehicle available in the United States with a correlation coefficient (R) of -0.236 and weighted average of 10.2%, a difference of 2.7%.
No Vehicles in Household Correlation Summary
| Measurement | Arab | Immigrants from Austria |
| Minimum | 1.9% | 1.1% |
| Maximum | 30.0% | 13.3% |
| Range | 28.1% | 12.2% |
| Mean | 9.8% | 6.6% |
| Median | 8.4% | 6.3% |
| Interquartile 25% (IQ1) | 5.6% | 4.0% |
| Interquartile 75% (IQ3) | 12.5% | 9.2% |
| Interquartile Range (IQR) | 6.9% | 5.2% |
| Standard Deviation (Sample) | 5.8% | 3.0% |
| Standard Deviation (Population) | 5.8% | 3.0% |
Demographics Similar to Arabs and Immigrants from Austria by No Vehicles in Household
In terms of no vehicles in household, the demographic groups most similar to Arabs are Ethiopian (10.5%, a difference of 0.060%), Immigrants from Colombia (10.5%, a difference of 0.16%), Immigrants from Ethiopia (10.4%, a difference of 0.36%), Immigrants from El Salvador (10.4%, a difference of 0.51%), and Immigrants from Burma/Myanmar (10.4%, a difference of 0.52%). Similarly, the demographic groups most similar to Immigrants from Austria are New Zealander (10.2%, a difference of 0.10%), Immigrants from Cambodia (10.2%, a difference of 0.11%), South African (10.2%, a difference of 0.48%), Comanche (10.2%, a difference of 0.52%), and Immigrants from Costa Rica (10.3%, a difference of 0.58%).
| Demographics | Rating | Rank | No Vehicles in Household |
| New Zealanders | 65.1 /100 | #161 | Good 10.2% |
| Immigrants | Austria | 64.4 /100 | #162 | Good 10.2% |
| Immigrants | Cambodia | 63.7 /100 | #163 | Good 10.2% |
| South Africans | 61.1 /100 | #164 | Good 10.2% |
| Comanche | 60.8 /100 | #165 | Good 10.2% |
| Immigrants | Costa Rica | 60.5 /100 | #166 | Good 10.3% |
| Immigrants | Saudi Arabia | 58.8 /100 | #167 | Average 10.3% |
| Indonesians | 56.7 /100 | #168 | Average 10.3% |
| Lumbee | 54.7 /100 | #169 | Average 10.3% |
| Immigrants | Latin America | 53.2 /100 | #170 | Average 10.4% |
| Hmong | 52.7 /100 | #171 | Average 10.4% |
| Brazilians | 51.7 /100 | #172 | Average 10.4% |
| Filipinos | 50.1 /100 | #173 | Average 10.4% |
| Immigrants | Sudan | 50.0 /100 | #174 | Average 10.4% |
| Immigrants | Burma/Myanmar | 49.1 /100 | #175 | Average 10.4% |
| French American Indians | 49.1 /100 | #176 | Average 10.4% |
| Immigrants | El Salvador | 49.1 /100 | #177 | Average 10.4% |
| Immigrants | Ethiopia | 48.0 /100 | #178 | Average 10.4% |
| Ethiopians | 45.8 /100 | #179 | Average 10.5% |
| Arabs | 45.3 /100 | #180 | Average 10.5% |
| Immigrants | Colombia | 44.1 /100 | #181 | Average 10.5% |