Arab vs Immigrants from Austria 2nd Grade
COMPARE
Arab
Immigrants from Austria
2nd Grade
2nd Grade Comparison
Arabs
Immigrants from Austria
97.8%
2ND GRADE
36.9/ 100
METRIC RATING
186th/ 347
METRIC RANK
98.3%
2ND GRADE
99.6/ 100
METRIC RATING
69th/ 347
METRIC RANK
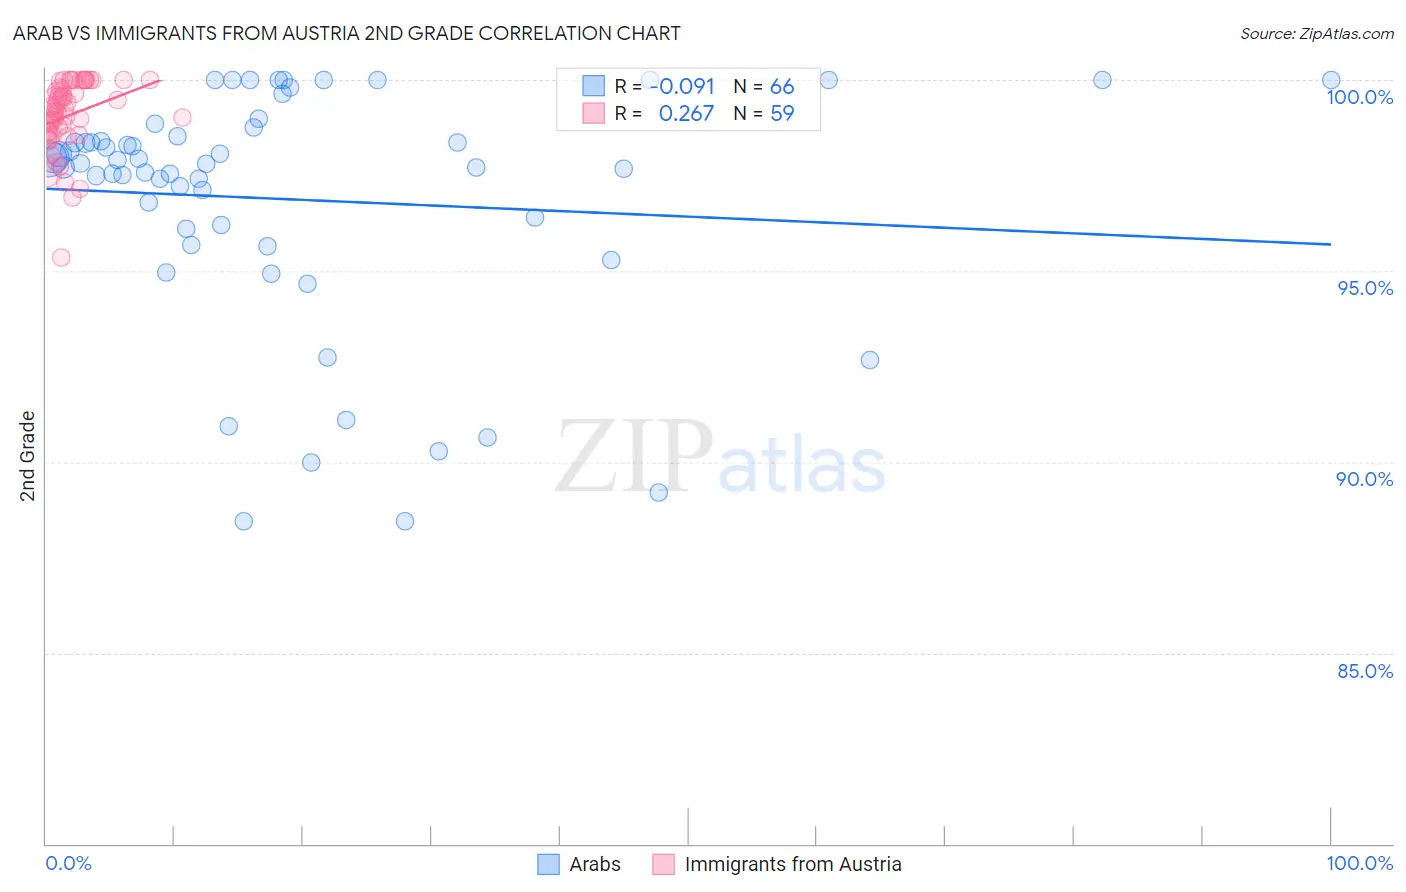
Arab vs Immigrants from Austria 2nd Grade Correlation Chart
The statistical analysis conducted on geographies consisting of 486,872,222 people shows a slight negative correlation between the proportion of Arabs and percentage of population with at least 2nd grade education in the United States with a correlation coefficient (R) of -0.091 and weighted average of 97.8%. Similarly, the statistical analysis conducted on geographies consisting of 167,973,800 people shows a weak positive correlation between the proportion of Immigrants from Austria and percentage of population with at least 2nd grade education in the United States with a correlation coefficient (R) of 0.267 and weighted average of 98.3%, a difference of 0.49%.
2nd Grade Correlation Summary
| Measurement | Arab | Immigrants from Austria |
| Minimum | 88.4% | 95.4% |
| Maximum | 100.0% | 100.0% |
| Range | 11.6% | 4.6% |
| Mean | 96.9% | 99.1% |
| Median | 97.8% | 99.2% |
| Interquartile 25% (IQ1) | 96.1% | 98.6% |
| Interquartile 75% (IQ3) | 98.5% | 99.8% |
| Interquartile Range (IQR) | 2.4% | 1.2% |
| Standard Deviation (Sample) | 3.1% | 0.93% |
| Standard Deviation (Population) | 3.1% | 0.92% |
Similar Demographics by 2nd Grade
Demographics Similar to Arabs by 2nd Grade
In terms of 2nd grade, the demographic groups most similar to Arabs are Pakistani (97.8%, a difference of 0.0%), Immigrants from Kazakhstan (97.8%, a difference of 0.0%), Immigrants from Argentina (97.8%, a difference of 0.010%), Panamanian (97.8%, a difference of 0.010%), and Native/Alaskan (97.9%, a difference of 0.020%).
| Demographics | Rating | Rank | 2nd Grade |
| Immigrants | Venezuela | 46.1 /100 | #179 | Average 97.9% |
| Natives/Alaskans | 44.3 /100 | #180 | Average 97.9% |
| Egyptians | 44.3 /100 | #181 | Average 97.9% |
| Portuguese | 42.4 /100 | #182 | Average 97.8% |
| Immigrants | Poland | 42.2 /100 | #183 | Average 97.8% |
| Immigrants | Belarus | 41.5 /100 | #184 | Average 97.8% |
| Immigrants | Argentina | 40.6 /100 | #185 | Average 97.8% |
| Arabs | 36.9 /100 | #186 | Fair 97.8% |
| Pakistanis | 36.1 /100 | #187 | Fair 97.8% |
| Immigrants | Kazakhstan | 35.6 /100 | #188 | Fair 97.8% |
| Panamanians | 33.5 /100 | #189 | Fair 97.8% |
| Immigrants | Taiwan | 31.8 /100 | #190 | Fair 97.8% |
| Paraguayans | 30.8 /100 | #191 | Fair 97.8% |
| Blacks/African Americans | 29.9 /100 | #192 | Fair 97.8% |
| Hawaiians | 28.5 /100 | #193 | Fair 97.8% |
Demographics Similar to Immigrants from Austria by 2nd Grade
In terms of 2nd grade, the demographic groups most similar to Immigrants from Austria are Immigrants from Northern Europe (98.3%, a difference of 0.0%), Russian (98.3%, a difference of 0.0%), Serbian (98.3%, a difference of 0.0%), Chickasaw (98.3%, a difference of 0.0%), and Canadian (98.3%, a difference of 0.010%).
| Demographics | Rating | Rank | 2nd Grade |
| Greeks | 99.8 /100 | #62 | Exceptional 98.3% |
| Maltese | 99.7 /100 | #63 | Exceptional 98.3% |
| Immigrants | North America | 99.7 /100 | #64 | Exceptional 98.3% |
| New Zealanders | 99.7 /100 | #65 | Exceptional 98.3% |
| Canadians | 99.7 /100 | #66 | Exceptional 98.3% |
| Immigrants | Northern Europe | 99.7 /100 | #67 | Exceptional 98.3% |
| Russians | 99.7 /100 | #68 | Exceptional 98.3% |
| Immigrants | Austria | 99.6 /100 | #69 | Exceptional 98.3% |
| Serbians | 99.6 /100 | #70 | Exceptional 98.3% |
| Chickasaw | 99.6 /100 | #71 | Exceptional 98.3% |
| Cheyenne | 99.6 /100 | #72 | Exceptional 98.3% |
| Cajuns | 99.5 /100 | #73 | Exceptional 98.3% |
| Immigrants | Netherlands | 99.4 /100 | #74 | Exceptional 98.3% |
| Shoshone | 99.4 /100 | #75 | Exceptional 98.3% |
| Cherokee | 99.4 /100 | #76 | Exceptional 98.3% |