Arab vs Immigrants from West Indies No Vehicles in Household
COMPARE
Arab
Immigrants from West Indies
No Vehicles in Household
No Vehicles in Household Comparison
Arabs
Immigrants from West Indies
10.5%
NO VEHICLES IN HOUSEHOLD
45.3/ 100
METRIC RATING
180th/ 347
METRIC RANK
20.5%
NO VEHICLES IN HOUSEHOLD
0.0/ 100
METRIC RATING
326th/ 347
METRIC RANK
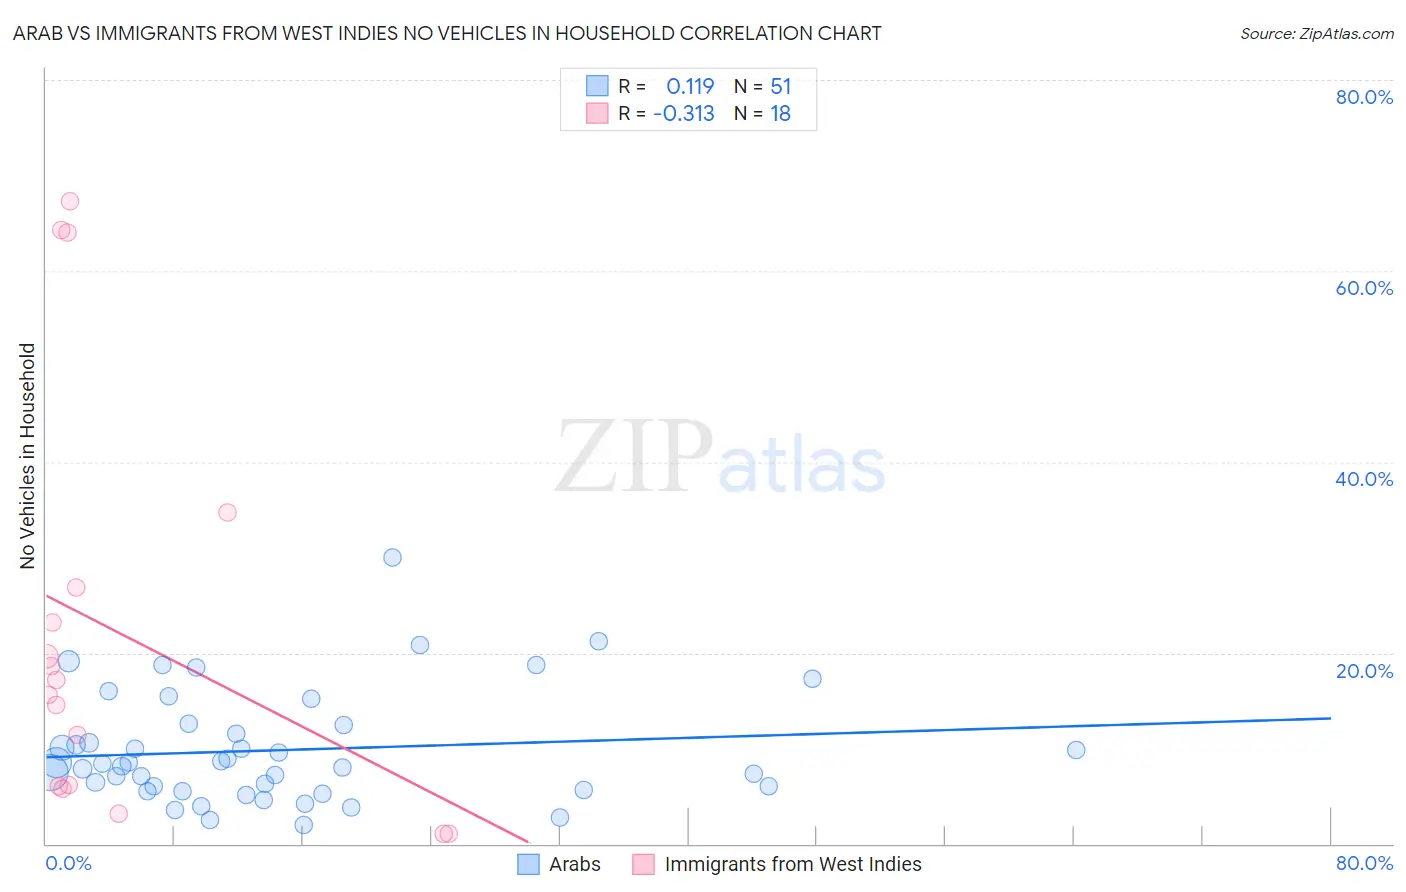
Arab vs Immigrants from West Indies No Vehicles in Household Correlation Chart
The statistical analysis conducted on geographies consisting of 484,728,564 people shows a poor positive correlation between the proportion of Arabs and percentage of households with no vehicle available in the United States with a correlation coefficient (R) of 0.119 and weighted average of 10.5%. Similarly, the statistical analysis conducted on geographies consisting of 72,444,835 people shows a mild negative correlation between the proportion of Immigrants from West Indies and percentage of households with no vehicle available in the United States with a correlation coefficient (R) of -0.313 and weighted average of 20.5%, a difference of 96.1%.
No Vehicles in Household Correlation Summary
| Measurement | Arab | Immigrants from West Indies |
| Minimum | 1.9% | 1.0% |
| Maximum | 30.0% | 67.3% |
| Range | 28.1% | 66.3% |
| Mean | 9.8% | 22.2% |
| Median | 8.4% | 16.4% |
| Interquartile 25% (IQ1) | 5.6% | 6.0% |
| Interquartile 75% (IQ3) | 12.5% | 26.8% |
| Interquartile Range (IQR) | 6.9% | 20.8% |
| Standard Deviation (Sample) | 5.8% | 21.8% |
| Standard Deviation (Population) | 5.8% | 21.2% |
Similar Demographics by No Vehicles in Household
Demographics Similar to Arabs by No Vehicles in Household
In terms of no vehicles in household, the demographic groups most similar to Arabs are Ethiopian (10.5%, a difference of 0.060%), Immigrants from Colombia (10.5%, a difference of 0.16%), Immigrants from Bulgaria (10.5%, a difference of 0.20%), Native/Alaskan (10.5%, a difference of 0.22%), and Immigrants from Ethiopia (10.4%, a difference of 0.36%).
| Demographics | Rating | Rank | No Vehicles in Household |
| Filipinos | 50.1 /100 | #173 | Average 10.4% |
| Immigrants | Sudan | 50.0 /100 | #174 | Average 10.4% |
| Immigrants | Burma/Myanmar | 49.1 /100 | #175 | Average 10.4% |
| French American Indians | 49.1 /100 | #176 | Average 10.4% |
| Immigrants | El Salvador | 49.1 /100 | #177 | Average 10.4% |
| Immigrants | Ethiopia | 48.0 /100 | #178 | Average 10.4% |
| Ethiopians | 45.8 /100 | #179 | Average 10.5% |
| Arabs | 45.3 /100 | #180 | Average 10.5% |
| Immigrants | Colombia | 44.1 /100 | #181 | Average 10.5% |
| Immigrants | Bulgaria | 43.8 /100 | #182 | Average 10.5% |
| Natives/Alaskans | 43.7 /100 | #183 | Average 10.5% |
| Immigrants | Nepal | 42.4 /100 | #184 | Average 10.5% |
| South Americans | 41.9 /100 | #185 | Average 10.5% |
| German Russians | 40.6 /100 | #186 | Average 10.5% |
| Immigrants | Poland | 38.4 /100 | #187 | Fair 10.6% |
Demographics Similar to Immigrants from West Indies by No Vehicles in Household
In terms of no vehicles in household, the demographic groups most similar to Immigrants from West Indies are Immigrants from Senegal (21.1%, a difference of 3.0%), Senegalese (19.8%, a difference of 3.9%), Immigrants from Caribbean (19.6%, a difference of 4.7%), Immigrants from Yemen (19.5%, a difference of 5.5%), and Immigrants from Dominica (22.2%, a difference of 8.3%).
| Demographics | Rating | Rank | No Vehicles in Household |
| Alaska Natives | 0.0 /100 | #319 | Tragic 17.4% |
| Soviet Union | 0.0 /100 | #320 | Tragic 17.4% |
| Jamaicans | 0.0 /100 | #321 | Tragic 17.9% |
| Immigrants | Cabo Verde | 0.0 /100 | #322 | Tragic 18.4% |
| Immigrants | Yemen | 0.0 /100 | #323 | Tragic 19.5% |
| Immigrants | Caribbean | 0.0 /100 | #324 | Tragic 19.6% |
| Senegalese | 0.0 /100 | #325 | Tragic 19.8% |
| Immigrants | West Indies | 0.0 /100 | #326 | Tragic 20.5% |
| Immigrants | Senegal | 0.0 /100 | #327 | Tragic 21.1% |
| Immigrants | Dominica | 0.0 /100 | #328 | Tragic 22.2% |
| Ecuadorians | 0.0 /100 | #329 | Tragic 22.8% |
| West Indians | 0.0 /100 | #330 | Tragic 23.7% |
| Trinidadians and Tobagonians | 0.0 /100 | #331 | Tragic 23.7% |
| Immigrants | Ecuador | 0.0 /100 | #332 | Tragic 23.8% |
| Immigrants | Trinidad and Tobago | 0.0 /100 | #333 | Tragic 24.6% |