Arab vs Cambodian No Vehicles in Household
COMPARE
Arab
Cambodian
No Vehicles in Household
No Vehicles in Household Comparison
Arabs
Cambodians
10.5%
NO VEHICLES IN HOUSEHOLD
45.3/ 100
METRIC RATING
180th/ 347
METRIC RANK
10.9%
NO VEHICLES IN HOUSEHOLD
19.6/ 100
METRIC RATING
200th/ 347
METRIC RANK
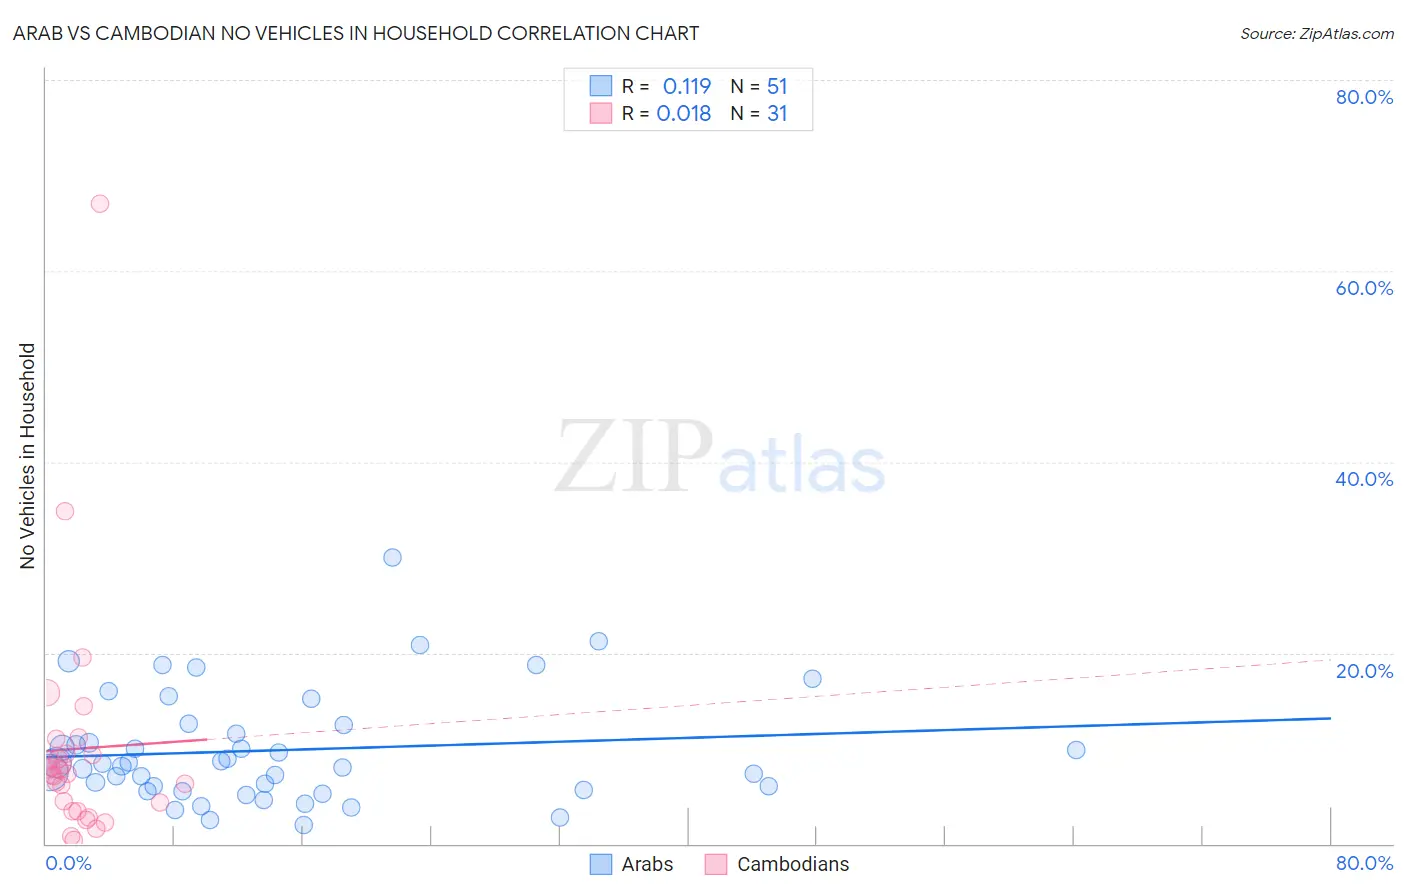
Arab vs Cambodian No Vehicles in Household Correlation Chart
The statistical analysis conducted on geographies consisting of 484,728,564 people shows a poor positive correlation between the proportion of Arabs and percentage of households with no vehicle available in the United States with a correlation coefficient (R) of 0.119 and weighted average of 10.5%. Similarly, the statistical analysis conducted on geographies consisting of 102,425,487 people shows no correlation between the proportion of Cambodians and percentage of households with no vehicle available in the United States with a correlation coefficient (R) of 0.018 and weighted average of 10.9%, a difference of 4.1%.
No Vehicles in Household Correlation Summary
| Measurement | Arab | Cambodian |
| Minimum | 1.9% | 0.45% |
| Maximum | 30.0% | 67.0% |
| Range | 28.1% | 66.6% |
| Mean | 9.8% | 9.9% |
| Median | 8.4% | 7.4% |
| Interquartile 25% (IQ1) | 5.6% | 3.4% |
| Interquartile 75% (IQ3) | 12.5% | 9.4% |
| Interquartile Range (IQR) | 6.9% | 6.0% |
| Standard Deviation (Sample) | 5.8% | 12.5% |
| Standard Deviation (Population) | 5.8% | 12.3% |
Demographics Similar to Arabs and Cambodians by No Vehicles in Household
In terms of no vehicles in household, the demographic groups most similar to Arabs are Immigrants from Colombia (10.5%, a difference of 0.16%), Immigrants from Bulgaria (10.5%, a difference of 0.20%), Native/Alaskan (10.5%, a difference of 0.22%), Immigrants from Nepal (10.5%, a difference of 0.39%), and South American (10.5%, a difference of 0.46%). Similarly, the demographic groups most similar to Cambodians are Immigrants from Asia (10.9%, a difference of 0.33%), Immigrants from Sweden (10.8%, a difference of 0.64%), Shoshone (10.8%, a difference of 0.85%), Central American (10.8%, a difference of 0.89%), and Immigrants from Brazil (10.8%, a difference of 1.2%).
| Demographics | Rating | Rank | No Vehicles in Household |
| Arabs | 45.3 /100 | #180 | Average 10.5% |
| Immigrants | Colombia | 44.1 /100 | #181 | Average 10.5% |
| Immigrants | Bulgaria | 43.8 /100 | #182 | Average 10.5% |
| Natives/Alaskans | 43.7 /100 | #183 | Average 10.5% |
| Immigrants | Nepal | 42.4 /100 | #184 | Average 10.5% |
| South Americans | 41.9 /100 | #185 | Average 10.5% |
| German Russians | 40.6 /100 | #186 | Average 10.5% |
| Immigrants | Poland | 38.4 /100 | #187 | Fair 10.6% |
| Immigrants | Armenia | 37.5 /100 | #188 | Fair 10.6% |
| Immigrants | Eritrea | 36.3 /100 | #189 | Fair 10.6% |
| Immigrants | North Macedonia | 34.6 /100 | #190 | Fair 10.6% |
| Immigrants | Northern Europe | 33.1 /100 | #191 | Fair 10.7% |
| Carpatho Rusyns | 32.1 /100 | #192 | Fair 10.7% |
| Ukrainians | 28.0 /100 | #193 | Fair 10.7% |
| Pueblo | 27.0 /100 | #194 | Fair 10.8% |
| Immigrants | Brazil | 26.3 /100 | #195 | Fair 10.8% |
| Central Americans | 24.3 /100 | #196 | Fair 10.8% |
| Shoshone | 24.1 /100 | #197 | Fair 10.8% |
| Immigrants | Sweden | 22.9 /100 | #198 | Fair 10.8% |
| Immigrants | Asia | 21.3 /100 | #199 | Fair 10.9% |
| Cambodians | 19.6 /100 | #200 | Poor 10.9% |