Arab vs Immigrants from Austria Median Male Earnings
COMPARE
Arab
Immigrants from Austria
Median Male Earnings
Median Male Earnings Comparison
Arabs
Immigrants from Austria
$57,298
MEDIAN MALE EARNINGS
94.0/ 100
METRIC RATING
119th/ 347
METRIC RANK
$62,164
MEDIAN MALE EARNINGS
99.9/ 100
METRIC RATING
47th/ 347
METRIC RANK
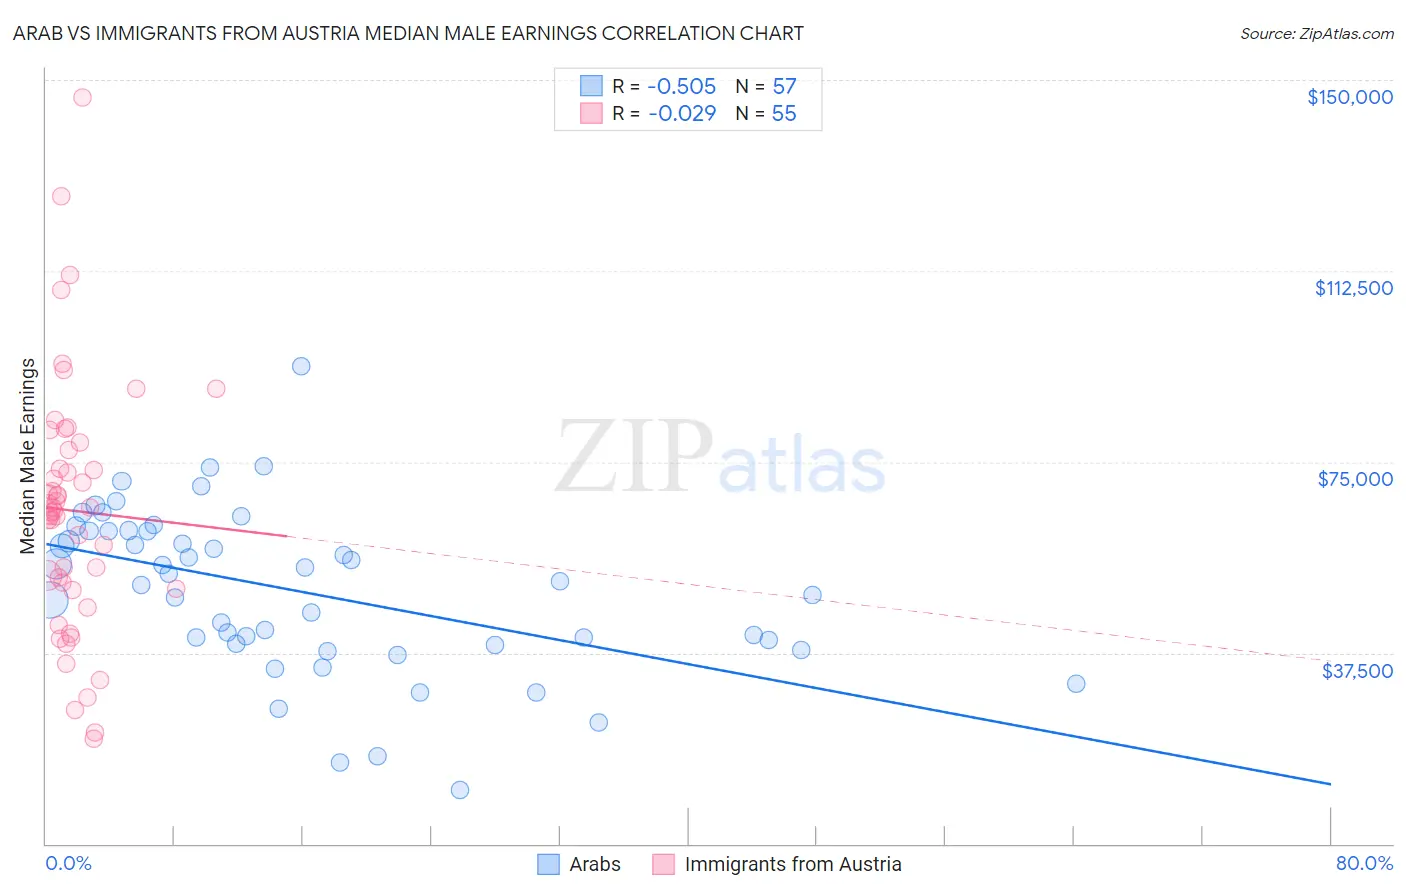
Arab vs Immigrants from Austria Median Male Earnings Correlation Chart
The statistical analysis conducted on geographies consisting of 486,638,501 people shows a substantial negative correlation between the proportion of Arabs and median male earnings in the United States with a correlation coefficient (R) of -0.505 and weighted average of $57,298. Similarly, the statistical analysis conducted on geographies consisting of 167,941,701 people shows no correlation between the proportion of Immigrants from Austria and median male earnings in the United States with a correlation coefficient (R) of -0.029 and weighted average of $62,164, a difference of 8.5%.
Median Male Earnings Correlation Summary
| Measurement | Arab | Immigrants from Austria |
| Minimum | $10,662 | $20,568 |
| Maximum | $93,845 | $146,444 |
| Range | $83,183 | $125,876 |
| Mean | $49,636 | $65,411 |
| Median | $51,622 | $65,258 |
| Interquartile 25% (IQ1) | $39,178 | $50,000 |
| Interquartile 75% (IQ3) | $61,412 | $77,315 |
| Interquartile Range (IQR) | $22,233 | $27,315 |
| Standard Deviation (Sample) | $16,136 | $24,493 |
| Standard Deviation (Population) | $15,994 | $24,269 |
Similar Demographics by Median Male Earnings
Demographics Similar to Arabs by Median Male Earnings
In terms of median male earnings, the demographic groups most similar to Arabs are Hungarian ($57,309, a difference of 0.020%), Canadian ($57,286, a difference of 0.020%), Immigrants from Zimbabwe ($57,352, a difference of 0.090%), Lebanese ($57,409, a difference of 0.19%), and Immigrants from Albania ($57,179, a difference of 0.21%).
| Demographics | Rating | Rank | Median Male Earnings |
| Immigrants | Afghanistan | 95.4 /100 | #112 | Exceptional $57,582 |
| Carpatho Rusyns | 95.3 /100 | #113 | Exceptional $57,572 |
| Immigrants | Kuwait | 95.3 /100 | #114 | Exceptional $57,562 |
| Swedes | 94.8 /100 | #115 | Exceptional $57,445 |
| Lebanese | 94.6 /100 | #116 | Exceptional $57,409 |
| Immigrants | Zimbabwe | 94.3 /100 | #117 | Exceptional $57,352 |
| Hungarians | 94.0 /100 | #118 | Exceptional $57,309 |
| Arabs | 94.0 /100 | #119 | Exceptional $57,298 |
| Canadians | 93.9 /100 | #120 | Exceptional $57,286 |
| Immigrants | Albania | 93.3 /100 | #121 | Exceptional $57,179 |
| Immigrants | Jordan | 93.1 /100 | #122 | Exceptional $57,145 |
| Slovenes | 93.1 /100 | #123 | Exceptional $57,145 |
| Chileans | 91.9 /100 | #124 | Exceptional $56,973 |
| Immigrants | Morocco | 91.8 /100 | #125 | Exceptional $56,958 |
| Chinese | 91.1 /100 | #126 | Exceptional $56,872 |
Demographics Similar to Immigrants from Austria by Median Male Earnings
In terms of median male earnings, the demographic groups most similar to Immigrants from Austria are Immigrants from Malaysia ($62,121, a difference of 0.070%), Immigrants from Czechoslovakia ($62,217, a difference of 0.090%), Immigrants from Europe ($62,057, a difference of 0.17%), Bulgarian ($62,378, a difference of 0.35%), and Cambodian ($62,516, a difference of 0.57%).
| Demographics | Rating | Rank | Median Male Earnings |
| Australians | 100.0 /100 | #40 | Exceptional $62,857 |
| Immigrants | Turkey | 100.0 /100 | #41 | Exceptional $62,728 |
| Immigrants | Greece | 100.0 /100 | #42 | Exceptional $62,689 |
| Immigrants | Belarus | 100.0 /100 | #43 | Exceptional $62,658 |
| Cambodians | 100.0 /100 | #44 | Exceptional $62,516 |
| Bulgarians | 100.0 /100 | #45 | Exceptional $62,378 |
| Immigrants | Czechoslovakia | 99.9 /100 | #46 | Exceptional $62,217 |
| Immigrants | Austria | 99.9 /100 | #47 | Exceptional $62,164 |
| Immigrants | Malaysia | 99.9 /100 | #48 | Exceptional $62,121 |
| Immigrants | Europe | 99.9 /100 | #49 | Exceptional $62,057 |
| Bhutanese | 99.9 /100 | #50 | Exceptional $61,759 |
| Estonians | 99.9 /100 | #51 | Exceptional $61,710 |
| Immigrants | Norway | 99.9 /100 | #52 | Exceptional $61,628 |
| South Africans | 99.9 /100 | #53 | Exceptional $61,460 |
| Immigrants | Latvia | 99.9 /100 | #54 | Exceptional $61,422 |