Marshallese vs Immigrants from Austria No Vehicles in Household
COMPARE
Marshallese
Immigrants from Austria
No Vehicles in Household
No Vehicles in Household Comparison
Marshallese
Immigrants from Austria
9.8%
NO VEHICLES IN HOUSEHOLD
84.0/ 100
METRIC RATING
139th/ 347
METRIC RANK
10.2%
NO VEHICLES IN HOUSEHOLD
64.4/ 100
METRIC RATING
162nd/ 347
METRIC RANK
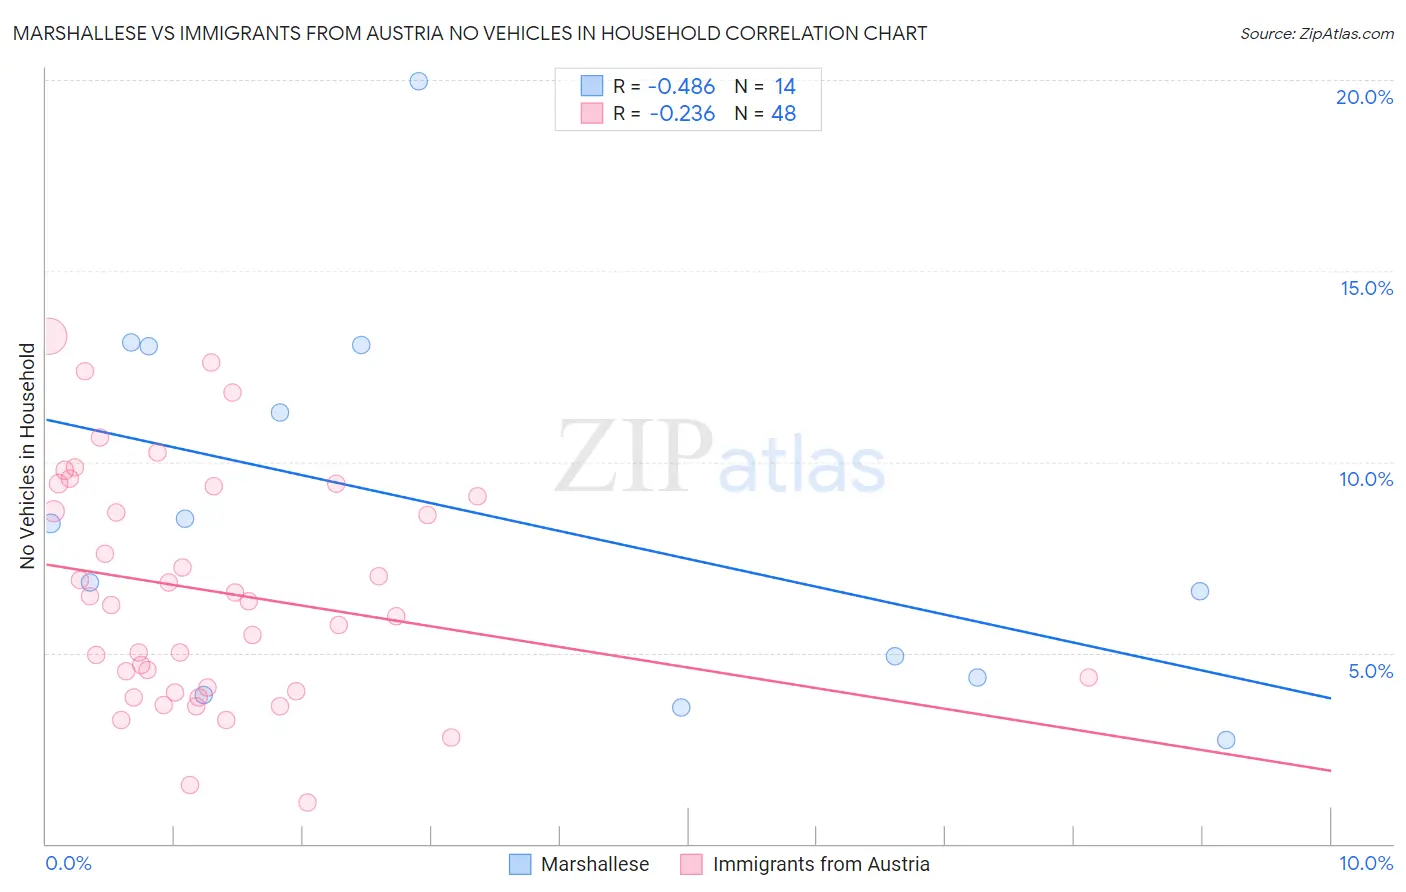
Marshallese vs Immigrants from Austria No Vehicles in Household Correlation Chart
The statistical analysis conducted on geographies consisting of 14,756,387 people shows a moderate negative correlation between the proportion of Marshallese and percentage of households with no vehicle available in the United States with a correlation coefficient (R) of -0.486 and weighted average of 9.8%. Similarly, the statistical analysis conducted on geographies consisting of 167,824,627 people shows a weak negative correlation between the proportion of Immigrants from Austria and percentage of households with no vehicle available in the United States with a correlation coefficient (R) of -0.236 and weighted average of 10.2%, a difference of 3.8%.
No Vehicles in Household Correlation Summary
| Measurement | Marshallese | Immigrants from Austria |
| Minimum | 2.7% | 1.1% |
| Maximum | 20.0% | 13.3% |
| Range | 17.3% | 12.2% |
| Mean | 8.6% | 6.6% |
| Median | 7.6% | 6.3% |
| Interquartile 25% (IQ1) | 4.3% | 4.0% |
| Interquartile 75% (IQ3) | 13.0% | 9.2% |
| Interquartile Range (IQR) | 8.7% | 5.2% |
| Standard Deviation (Sample) | 4.9% | 3.0% |
| Standard Deviation (Population) | 4.8% | 3.0% |
Similar Demographics by No Vehicles in Household
Demographics Similar to Marshallese by No Vehicles in Household
In terms of no vehicles in household, the demographic groups most similar to Marshallese are Immigrants from Lithuania (9.8%, a difference of 0.010%), Estonian (9.8%, a difference of 0.050%), Immigrants from Moldova (9.8%, a difference of 0.16%), Sudanese (9.8%, a difference of 0.23%), and Immigrants from South Africa (9.8%, a difference of 0.26%).
| Demographics | Rating | Rank | No Vehicles in Household |
| Kenyans | 88.0 /100 | #132 | Excellent 9.7% |
| Immigrants | Oceania | 87.1 /100 | #133 | Excellent 9.7% |
| Syrians | 87.1 /100 | #134 | Excellent 9.7% |
| Latvians | 85.1 /100 | #135 | Excellent 9.8% |
| Immigrants | South Africa | 85.0 /100 | #136 | Excellent 9.8% |
| Immigrants | Moldova | 84.6 /100 | #137 | Excellent 9.8% |
| Estonians | 84.2 /100 | #138 | Excellent 9.8% |
| Marshallese | 84.0 /100 | #139 | Excellent 9.8% |
| Immigrants | Lithuania | 84.0 /100 | #140 | Excellent 9.8% |
| Sudanese | 83.1 /100 | #141 | Excellent 9.8% |
| Immigrants | Zimbabwe | 82.6 /100 | #142 | Excellent 9.9% |
| Chileans | 81.2 /100 | #143 | Excellent 9.9% |
| Immigrants | Bahamas | 81.2 /100 | #144 | Excellent 9.9% |
| Bahamians | 81.0 /100 | #145 | Excellent 9.9% |
| Hungarians | 80.0 /100 | #146 | Excellent 9.9% |
Demographics Similar to Immigrants from Austria by No Vehicles in Household
In terms of no vehicles in household, the demographic groups most similar to Immigrants from Austria are New Zealander (10.2%, a difference of 0.10%), Immigrants from Cambodia (10.2%, a difference of 0.11%), Immigrants from Middle Africa (10.2%, a difference of 0.20%), South African (10.2%, a difference of 0.48%), and Comanche (10.2%, a difference of 0.52%).
| Demographics | Rating | Rank | No Vehicles in Household |
| Salvadorans | 72.4 /100 | #155 | Good 10.1% |
| Immigrants | Micronesia | 70.9 /100 | #156 | Good 10.1% |
| Australians | 70.6 /100 | #157 | Good 10.1% |
| Spanish American Indians | 70.2 /100 | #158 | Good 10.1% |
| Immigrants | Indonesia | 69.3 /100 | #159 | Good 10.1% |
| Immigrants | Middle Africa | 65.7 /100 | #160 | Good 10.2% |
| New Zealanders | 65.1 /100 | #161 | Good 10.2% |
| Immigrants | Austria | 64.4 /100 | #162 | Good 10.2% |
| Immigrants | Cambodia | 63.7 /100 | #163 | Good 10.2% |
| South Africans | 61.1 /100 | #164 | Good 10.2% |
| Comanche | 60.8 /100 | #165 | Good 10.2% |
| Immigrants | Costa Rica | 60.5 /100 | #166 | Good 10.3% |
| Immigrants | Saudi Arabia | 58.8 /100 | #167 | Average 10.3% |
| Indonesians | 56.7 /100 | #168 | Average 10.3% |
| Lumbee | 54.7 /100 | #169 | Average 10.3% |