Arab vs Immigrants from Austria College, 1 year or more
COMPARE
Arab
Immigrants from Austria
College, 1 year or more
College, 1 year or more Comparison
Arabs
Immigrants from Austria
61.6%
COLLEGE, 1 YEAR OR MORE
93.9/ 100
METRIC RATING
117th/ 347
METRIC RANK
64.4%
COLLEGE, 1 YEAR OR MORE
99.8/ 100
METRIC RATING
50th/ 347
METRIC RANK
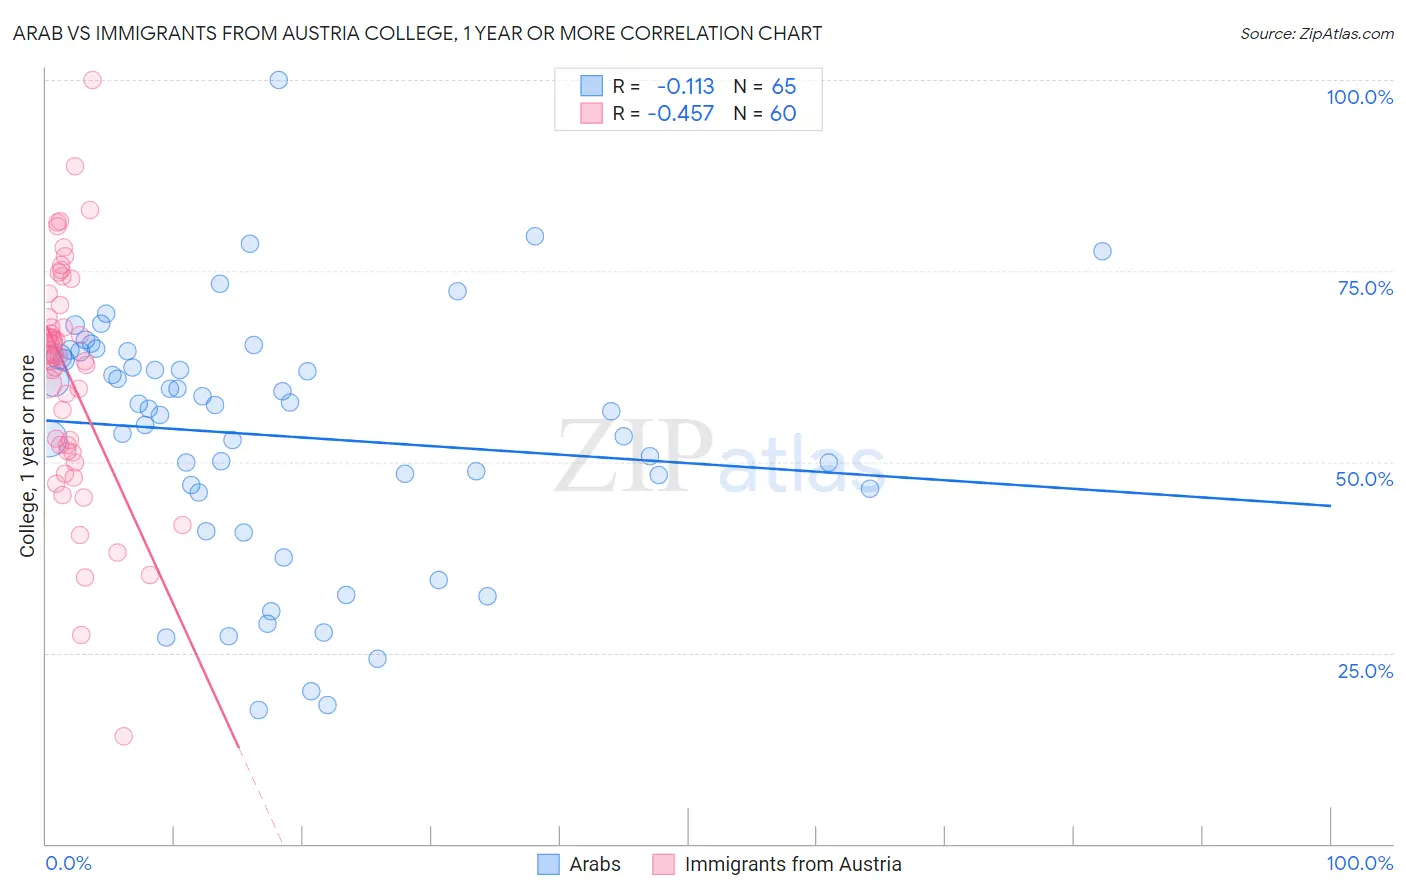
Arab vs Immigrants from Austria College, 1 year or more Correlation Chart
The statistical analysis conducted on geographies consisting of 486,868,588 people shows a poor negative correlation between the proportion of Arabs and percentage of population with at least college, 1 year or more education in the United States with a correlation coefficient (R) of -0.113 and weighted average of 61.6%. Similarly, the statistical analysis conducted on geographies consisting of 167,973,933 people shows a moderate negative correlation between the proportion of Immigrants from Austria and percentage of population with at least college, 1 year or more education in the United States with a correlation coefficient (R) of -0.457 and weighted average of 64.4%, a difference of 4.5%.
College, 1 year or more Correlation Summary
| Measurement | Arab | Immigrants from Austria |
| Minimum | 17.6% | 14.1% |
| Maximum | 100.0% | 100.0% |
| Range | 82.4% | 85.9% |
| Mean | 53.4% | 61.4% |
| Median | 57.0% | 63.9% |
| Interquartile 25% (IQ1) | 46.2% | 51.8% |
| Interquartile 75% (IQ3) | 64.1% | 69.7% |
| Interquartile Range (IQR) | 17.9% | 17.9% |
| Standard Deviation (Sample) | 16.3% | 15.3% |
| Standard Deviation (Population) | 16.2% | 15.1% |
Similar Demographics by College, 1 year or more
Demographics Similar to Arabs by College, 1 year or more
In terms of college, 1 year or more, the demographic groups most similar to Arabs are Immigrants from Brazil (61.6%, a difference of 0.0%), Lebanese (61.6%, a difference of 0.040%), Norwegian (61.7%, a difference of 0.14%), Assyrian/Chaldean/Syriac (61.5%, a difference of 0.14%), and Pakistani (61.5%, a difference of 0.14%).
| Demographics | Rating | Rank | College, 1 year or more |
| Europeans | 95.6 /100 | #110 | Exceptional 61.8% |
| Macedonians | 95.6 /100 | #111 | Exceptional 61.8% |
| Austrians | 95.4 /100 | #112 | Exceptional 61.8% |
| Ukrainians | 95.2 /100 | #113 | Exceptional 61.8% |
| Danes | 94.8 /100 | #114 | Exceptional 61.7% |
| Norwegians | 94.5 /100 | #115 | Exceptional 61.7% |
| Lebanese | 94.1 /100 | #116 | Exceptional 61.6% |
| Arabs | 93.9 /100 | #117 | Exceptional 61.6% |
| Immigrants | Brazil | 93.9 /100 | #118 | Exceptional 61.6% |
| Assyrians/Chaldeans/Syriacs | 93.3 /100 | #119 | Exceptional 61.5% |
| Pakistanis | 93.2 /100 | #120 | Exceptional 61.5% |
| Immigrants | Jordan | 92.7 /100 | #121 | Exceptional 61.4% |
| Immigrants | Chile | 92.3 /100 | #122 | Exceptional 61.4% |
| Serbians | 92.2 /100 | #123 | Exceptional 61.4% |
| Venezuelans | 92.1 /100 | #124 | Exceptional 61.3% |
Demographics Similar to Immigrants from Austria by College, 1 year or more
In terms of college, 1 year or more, the demographic groups most similar to Immigrants from Austria are Immigrants from Malaysia (64.3%, a difference of 0.080%), Immigrants from Netherlands (64.2%, a difference of 0.24%), Asian (64.2%, a difference of 0.26%), New Zealander (64.6%, a difference of 0.29%), and Zimbabwean (64.2%, a difference of 0.29%).
| Demographics | Rating | Rank | College, 1 year or more |
| Immigrants | Russia | 99.9 /100 | #43 | Exceptional 64.7% |
| Immigrants | Norway | 99.9 /100 | #44 | Exceptional 64.7% |
| Immigrants | Lithuania | 99.9 /100 | #45 | Exceptional 64.6% |
| Bhutanese | 99.9 /100 | #46 | Exceptional 64.6% |
| Australians | 99.9 /100 | #47 | Exceptional 64.6% |
| Immigrants | Bulgaria | 99.9 /100 | #48 | Exceptional 64.6% |
| New Zealanders | 99.9 /100 | #49 | Exceptional 64.6% |
| Immigrants | Austria | 99.8 /100 | #50 | Exceptional 64.4% |
| Immigrants | Malaysia | 99.8 /100 | #51 | Exceptional 64.3% |
| Immigrants | Netherlands | 99.8 /100 | #52 | Exceptional 64.2% |
| Asians | 99.8 /100 | #53 | Exceptional 64.2% |
| Zimbabweans | 99.8 /100 | #54 | Exceptional 64.2% |
| Immigrants | Belarus | 99.7 /100 | #55 | Exceptional 64.1% |
| Immigrants | Czechoslovakia | 99.7 /100 | #56 | Exceptional 64.1% |
| South Africans | 99.7 /100 | #57 | Exceptional 64.1% |