Zimbabwean vs New Zealander Unemployment Among Ages 25 to 29 years
COMPARE
Zimbabwean
New Zealander
Unemployment Among Ages 25 to 29 years
Unemployment Among Ages 25 to 29 years Comparison
Zimbabweans
New Zealanders
6.4%
UNEMPLOYMENT AMONG AGES 25 TO 29 YEARS
93.5/ 100
METRIC RATING
94th/ 347
METRIC RANK
6.0%
UNEMPLOYMENT AMONG AGES 25 TO 29 YEARS
99.8/ 100
METRIC RATING
25th/ 347
METRIC RANK
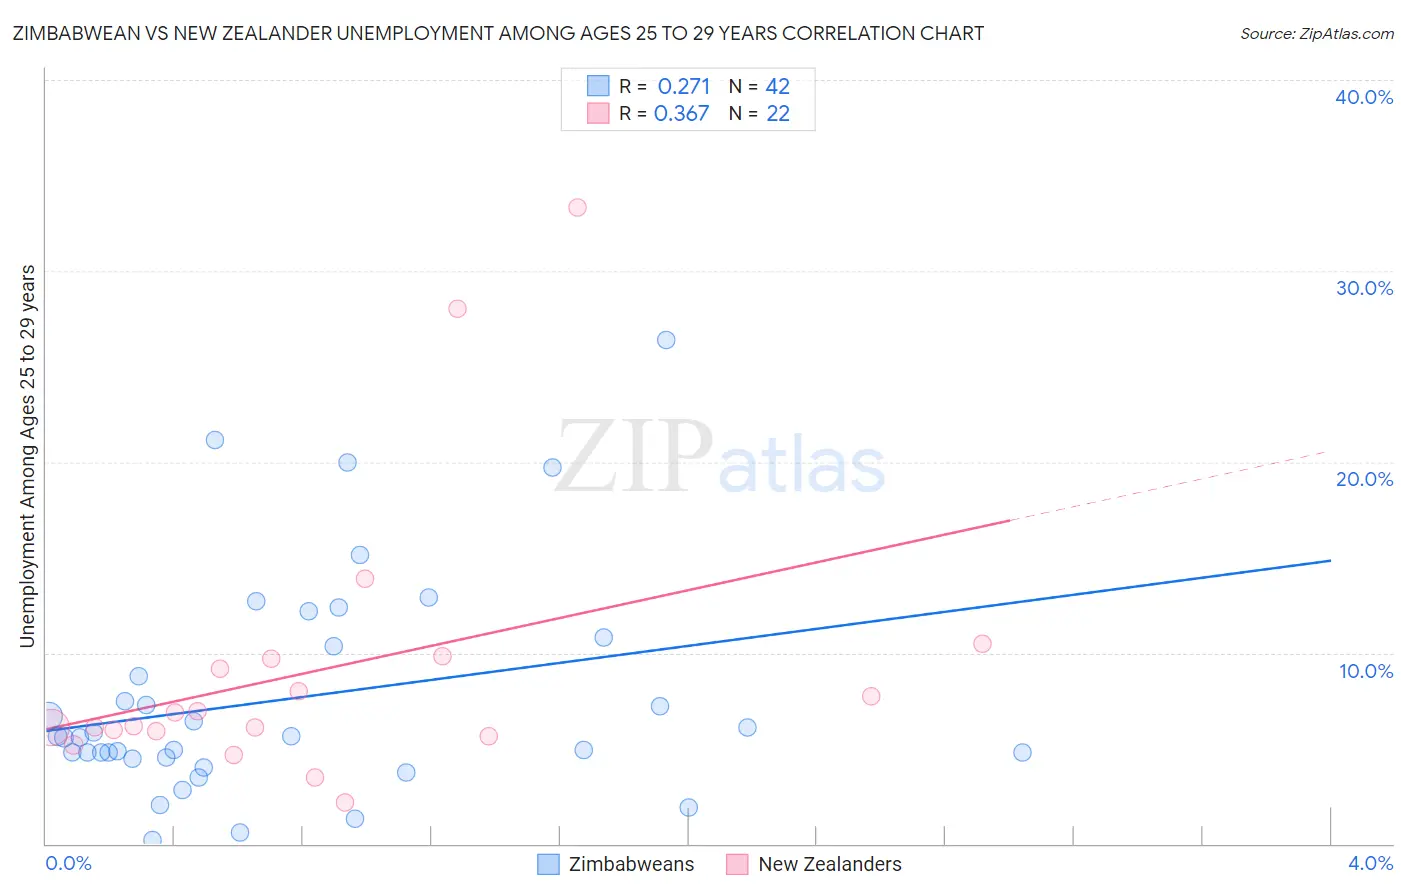
Zimbabwean vs New Zealander Unemployment Among Ages 25 to 29 years Correlation Chart
The statistical analysis conducted on geographies consisting of 68,469,968 people shows a weak positive correlation between the proportion of Zimbabweans and unemployment rate among population between the ages 25 and 29 in the United States with a correlation coefficient (R) of 0.271 and weighted average of 6.4%. Similarly, the statistical analysis conducted on geographies consisting of 104,668,755 people shows a mild positive correlation between the proportion of New Zealanders and unemployment rate among population between the ages 25 and 29 in the United States with a correlation coefficient (R) of 0.367 and weighted average of 6.0%, a difference of 5.8%.
Unemployment Among Ages 25 to 29 years Correlation Summary
| Measurement | Zimbabwean | New Zealander |
| Minimum | 0.20% | 2.1% |
| Maximum | 26.4% | 33.3% |
| Range | 26.2% | 31.2% |
| Mean | 7.6% | 9.1% |
| Median | 5.6% | 6.5% |
| Interquartile 25% (IQ1) | 4.5% | 5.9% |
| Interquartile 75% (IQ3) | 10.3% | 9.7% |
| Interquartile Range (IQR) | 5.8% | 3.8% |
| Standard Deviation (Sample) | 5.8% | 7.4% |
| Standard Deviation (Population) | 5.8% | 7.3% |
Similar Demographics by Unemployment Among Ages 25 to 29 years
Demographics Similar to Zimbabweans by Unemployment Among Ages 25 to 29 years
In terms of unemployment among ages 25 to 29 years, the demographic groups most similar to Zimbabweans are Immigrants from North Macedonia (6.4%, a difference of 0.050%), Australian (6.4%, a difference of 0.050%), Egyptian (6.4%, a difference of 0.11%), Lebanese (6.4%, a difference of 0.12%), and Immigrants from Oceania (6.4%, a difference of 0.19%).
| Demographics | Rating | Rank | Unemployment Among Ages 25 to 29 years |
| Marshallese | 94.7 /100 | #87 | Exceptional 6.4% |
| Immigrants | Indonesia | 94.5 /100 | #88 | Exceptional 6.4% |
| Immigrants | Oceania | 94.1 /100 | #89 | Exceptional 6.4% |
| Lebanese | 93.9 /100 | #90 | Exceptional 6.4% |
| Egyptians | 93.9 /100 | #91 | Exceptional 6.4% |
| Immigrants | North Macedonia | 93.6 /100 | #92 | Exceptional 6.4% |
| Australians | 93.6 /100 | #93 | Exceptional 6.4% |
| Zimbabweans | 93.5 /100 | #94 | Exceptional 6.4% |
| Afghans | 92.5 /100 | #95 | Exceptional 6.4% |
| Immigrants | Brazil | 92.1 /100 | #96 | Exceptional 6.4% |
| Immigrants | Eastern Europe | 91.9 /100 | #97 | Exceptional 6.4% |
| Serbians | 91.7 /100 | #98 | Exceptional 6.4% |
| Iraqis | 91.3 /100 | #99 | Exceptional 6.4% |
| Uruguayans | 91.2 /100 | #100 | Exceptional 6.4% |
| Immigrants | Ireland | 91.1 /100 | #101 | Exceptional 6.4% |
Demographics Similar to New Zealanders by Unemployment Among Ages 25 to 29 years
In terms of unemployment among ages 25 to 29 years, the demographic groups most similar to New Zealanders are Immigrants from Eastern Africa (6.0%, a difference of 0.070%), Immigrants from Zaire (6.0%, a difference of 0.20%), Danish (6.0%, a difference of 0.25%), Immigrants from South Central Asia (6.1%, a difference of 0.43%), and Bulgarian (6.1%, a difference of 0.54%).
| Demographics | Rating | Rank | Unemployment Among Ages 25 to 29 years |
| Immigrants | Singapore | 99.9 /100 | #18 | Exceptional 5.9% |
| Thais | 99.9 /100 | #19 | Exceptional 5.9% |
| Immigrants | Eritrea | 99.9 /100 | #20 | Exceptional 5.9% |
| Immigrants | Ethiopia | 99.9 /100 | #21 | Exceptional 6.0% |
| Immigrants | Japan | 99.9 /100 | #22 | Exceptional 6.0% |
| Immigrants | Venezuela | 99.8 /100 | #23 | Exceptional 6.0% |
| Norwegians | 99.8 /100 | #24 | Exceptional 6.0% |
| New Zealanders | 99.8 /100 | #25 | Exceptional 6.0% |
| Immigrants | Eastern Africa | 99.8 /100 | #26 | Exceptional 6.0% |
| Immigrants | Zaire | 99.7 /100 | #27 | Exceptional 6.0% |
| Danes | 99.7 /100 | #28 | Exceptional 6.0% |
| Immigrants | South Central Asia | 99.7 /100 | #29 | Exceptional 6.1% |
| Bulgarians | 99.7 /100 | #30 | Exceptional 6.1% |
| Filipinos | 99.7 /100 | #31 | Exceptional 6.1% |
| Chinese | 99.6 /100 | #32 | Exceptional 6.1% |