Slavic vs Immigrants from Eastern Africa Male Unemployment
COMPARE
Slavic
Immigrants from Eastern Africa
Male Unemployment
Male Unemployment Comparison
Slavs
Immigrants from Eastern Africa
5.1%
MALE UNEMPLOYMENT
94.2/ 100
METRIC RATING
92nd/ 347
METRIC RANK
5.2%
MALE UNEMPLOYMENT
79.8/ 100
METRIC RATING
137th/ 347
METRIC RANK
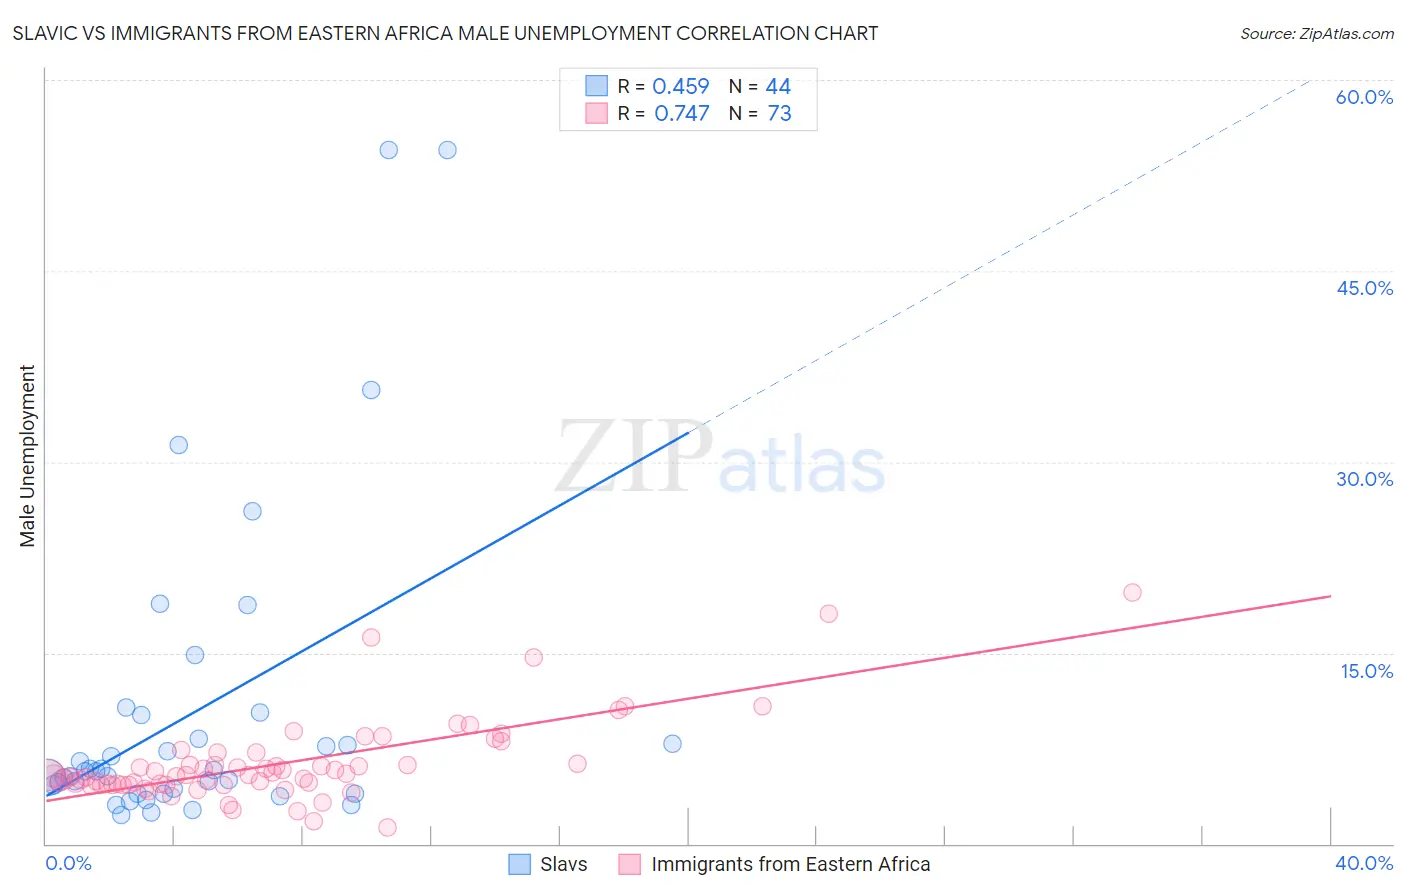
Slavic vs Immigrants from Eastern Africa Male Unemployment Correlation Chart
The statistical analysis conducted on geographies consisting of 270,129,729 people shows a moderate positive correlation between the proportion of Slavs and unemployment rate among males in the United States with a correlation coefficient (R) of 0.459 and weighted average of 5.1%. Similarly, the statistical analysis conducted on geographies consisting of 354,168,433 people shows a strong positive correlation between the proportion of Immigrants from Eastern Africa and unemployment rate among males in the United States with a correlation coefficient (R) of 0.747 and weighted average of 5.2%, a difference of 2.2%.
Male Unemployment Correlation Summary
| Measurement | Slavic | Immigrants from Eastern Africa |
| Minimum | 2.2% | 1.3% |
| Maximum | 54.5% | 19.7% |
| Range | 52.3% | 18.4% |
| Mean | 10.3% | 6.3% |
| Median | 5.7% | 5.4% |
| Interquartile 25% (IQ1) | 4.1% | 4.6% |
| Interquartile 75% (IQ3) | 9.1% | 6.7% |
| Interquartile Range (IQR) | 5.0% | 2.1% |
| Standard Deviation (Sample) | 12.2% | 3.3% |
| Standard Deviation (Population) | 12.1% | 3.2% |
Similar Demographics by Male Unemployment
Demographics Similar to Slavs by Male Unemployment
In terms of male unemployment, the demographic groups most similar to Slavs are Immigrants from Serbia (5.1%, a difference of 0.0%), Canadian (5.1%, a difference of 0.050%), Immigrants from Turkey (5.1%, a difference of 0.060%), Italian (5.1%, a difference of 0.12%), and Immigrants from Australia (5.1%, a difference of 0.14%).
| Demographics | Rating | Rank | Male Unemployment |
| Immigrants | North Macedonia | 95.6 /100 | #85 | Exceptional 5.1% |
| Maltese | 95.5 /100 | #86 | Exceptional 5.1% |
| Immigrants | Romania | 95.4 /100 | #87 | Exceptional 5.1% |
| Immigrants | Sri Lanka | 94.9 /100 | #88 | Exceptional 5.1% |
| Immigrants | Australia | 94.7 /100 | #89 | Exceptional 5.1% |
| Okinawans | 94.7 /100 | #90 | Exceptional 5.1% |
| Immigrants | Turkey | 94.4 /100 | #91 | Exceptional 5.1% |
| Slavs | 94.2 /100 | #92 | Exceptional 5.1% |
| Immigrants | Serbia | 94.2 /100 | #93 | Exceptional 5.1% |
| Canadians | 94.1 /100 | #94 | Exceptional 5.1% |
| Italians | 93.8 /100 | #95 | Exceptional 5.1% |
| Asians | 93.7 /100 | #96 | Exceptional 5.1% |
| Immigrants | Spain | 93.4 /100 | #97 | Exceptional 5.1% |
| Immigrants | Kuwait | 93.3 /100 | #98 | Exceptional 5.1% |
| Uruguayans | 93.0 /100 | #99 | Exceptional 5.1% |
Demographics Similar to Immigrants from Eastern Africa by Male Unemployment
In terms of male unemployment, the demographic groups most similar to Immigrants from Eastern Africa are Lebanese (5.2%, a difference of 0.010%), Immigrants from Croatia (5.2%, a difference of 0.010%), Immigrants from Saudi Arabia (5.2%, a difference of 0.030%), Kenyan (5.2%, a difference of 0.030%), and Brazilian (5.2%, a difference of 0.040%).
| Demographics | Rating | Rank | Male Unemployment |
| Immigrants | Malaysia | 83.5 /100 | #130 | Excellent 5.2% |
| Immigrants | Germany | 83.0 /100 | #131 | Excellent 5.2% |
| Chickasaw | 82.9 /100 | #132 | Excellent 5.2% |
| Colombians | 81.1 /100 | #133 | Excellent 5.2% |
| Pakistanis | 80.5 /100 | #134 | Excellent 5.2% |
| Immigrants | Saudi Arabia | 80.1 /100 | #135 | Excellent 5.2% |
| Lebanese | 79.9 /100 | #136 | Good 5.2% |
| Immigrants | Eastern Africa | 79.8 /100 | #137 | Good 5.2% |
| Immigrants | Croatia | 79.7 /100 | #138 | Good 5.2% |
| Kenyans | 79.4 /100 | #139 | Good 5.2% |
| Brazilians | 79.3 /100 | #140 | Good 5.2% |
| Immigrants | Switzerland | 79.2 /100 | #141 | Good 5.2% |
| Fijians | 78.3 /100 | #142 | Good 5.2% |
| Syrians | 78.0 /100 | #143 | Good 5.2% |
| Sri Lankans | 77.9 /100 | #144 | Good 5.2% |