Bhutanese vs Immigrants from Eastern Africa Male Unemployment
COMPARE
Bhutanese
Immigrants from Eastern Africa
Male Unemployment
Male Unemployment Comparison
Bhutanese
Immigrants from Eastern Africa
4.9%
MALE UNEMPLOYMENT
98.9/ 100
METRIC RATING
46th/ 347
METRIC RANK
5.2%
MALE UNEMPLOYMENT
79.8/ 100
METRIC RATING
137th/ 347
METRIC RANK
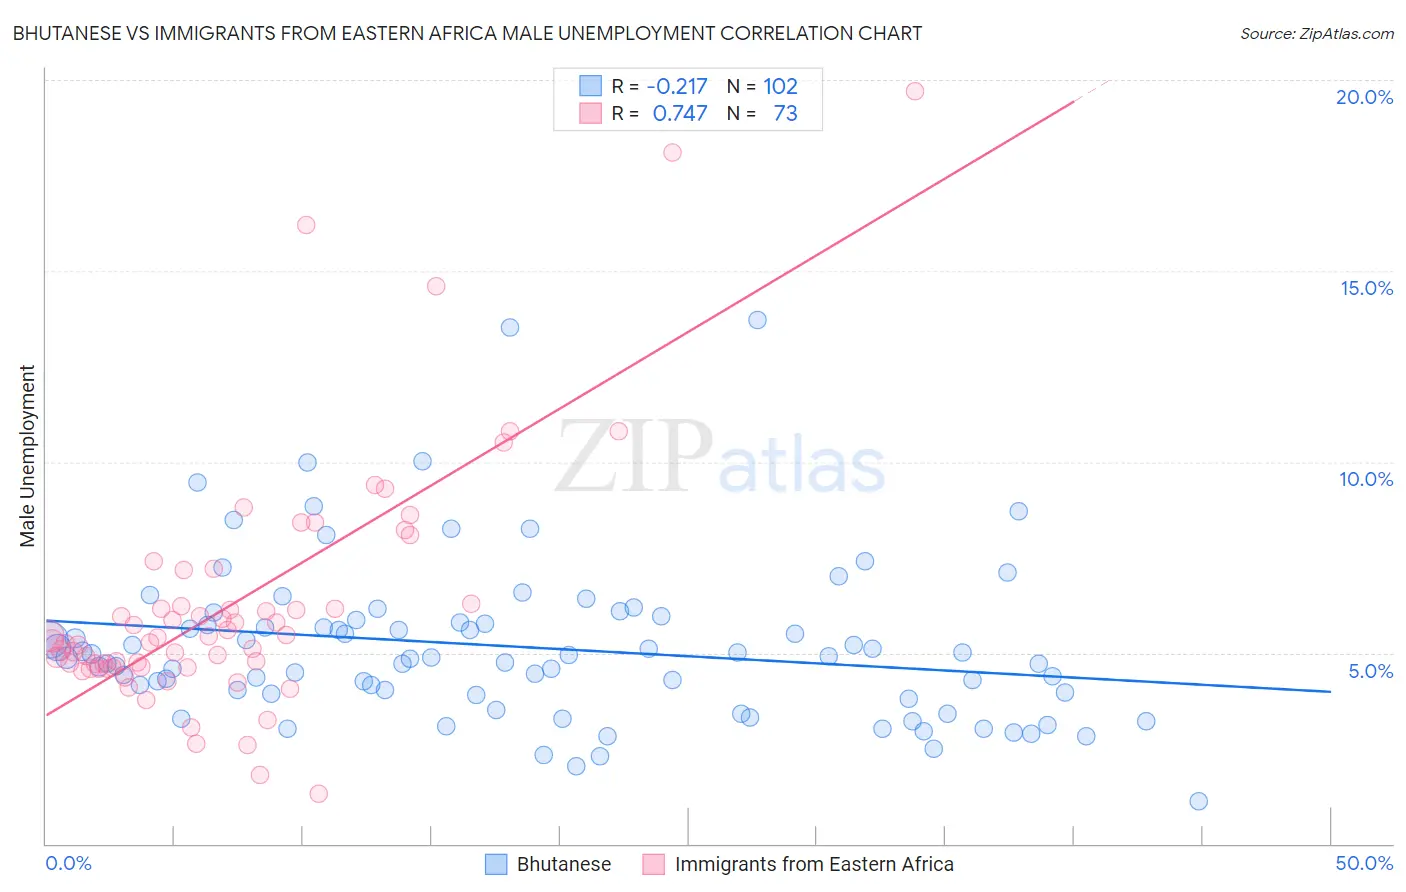
Bhutanese vs Immigrants from Eastern Africa Male Unemployment Correlation Chart
The statistical analysis conducted on geographies consisting of 452,760,879 people shows a weak negative correlation between the proportion of Bhutanese and unemployment rate among males in the United States with a correlation coefficient (R) of -0.217 and weighted average of 4.9%. Similarly, the statistical analysis conducted on geographies consisting of 354,168,433 people shows a strong positive correlation between the proportion of Immigrants from Eastern Africa and unemployment rate among males in the United States with a correlation coefficient (R) of 0.747 and weighted average of 5.2%, a difference of 5.0%.
Male Unemployment Correlation Summary
| Measurement | Bhutanese | Immigrants from Eastern Africa |
| Minimum | 1.1% | 1.3% |
| Maximum | 13.7% | 19.7% |
| Range | 12.6% | 18.4% |
| Mean | 5.2% | 6.3% |
| Median | 4.9% | 5.4% |
| Interquartile 25% (IQ1) | 3.9% | 4.6% |
| Interquartile 75% (IQ3) | 5.8% | 6.7% |
| Interquartile Range (IQR) | 1.9% | 2.1% |
| Standard Deviation (Sample) | 2.1% | 3.3% |
| Standard Deviation (Population) | 2.1% | 3.2% |
Similar Demographics by Male Unemployment
Demographics Similar to Bhutanese by Male Unemployment
In terms of male unemployment, the demographic groups most similar to Bhutanese are Austrian (4.9%, a difference of 0.070%), Immigrants from Zimbabwe (4.9%, a difference of 0.090%), Immigrants from Scotland (4.9%, a difference of 0.090%), Polish (4.9%, a difference of 0.10%), and Croatian (4.9%, a difference of 0.11%).
| Demographics | Rating | Rank | Male Unemployment |
| Burmese | 99.3 /100 | #39 | Exceptional 4.9% |
| Northern Europeans | 99.3 /100 | #40 | Exceptional 4.9% |
| Chinese | 99.3 /100 | #41 | Exceptional 4.9% |
| Immigrants | Belgium | 99.2 /100 | #42 | Exceptional 4.9% |
| Immigrants | Japan | 99.2 /100 | #43 | Exceptional 4.9% |
| Immigrants | Korea | 99.1 /100 | #44 | Exceptional 4.9% |
| Immigrants | Zimbabwe | 99.0 /100 | #45 | Exceptional 4.9% |
| Bhutanese | 98.9 /100 | #46 | Exceptional 4.9% |
| Austrians | 98.9 /100 | #47 | Exceptional 4.9% |
| Immigrants | Scotland | 98.9 /100 | #48 | Exceptional 4.9% |
| Poles | 98.9 /100 | #49 | Exceptional 4.9% |
| Croatians | 98.9 /100 | #50 | Exceptional 4.9% |
| Slovenes | 98.8 /100 | #51 | Exceptional 5.0% |
| Irish | 98.8 /100 | #52 | Exceptional 5.0% |
| Jordanians | 98.8 /100 | #53 | Exceptional 5.0% |
Demographics Similar to Immigrants from Eastern Africa by Male Unemployment
In terms of male unemployment, the demographic groups most similar to Immigrants from Eastern Africa are Lebanese (5.2%, a difference of 0.010%), Immigrants from Croatia (5.2%, a difference of 0.010%), Immigrants from Saudi Arabia (5.2%, a difference of 0.030%), Kenyan (5.2%, a difference of 0.030%), and Brazilian (5.2%, a difference of 0.040%).
| Demographics | Rating | Rank | Male Unemployment |
| Immigrants | Malaysia | 83.5 /100 | #130 | Excellent 5.2% |
| Immigrants | Germany | 83.0 /100 | #131 | Excellent 5.2% |
| Chickasaw | 82.9 /100 | #132 | Excellent 5.2% |
| Colombians | 81.1 /100 | #133 | Excellent 5.2% |
| Pakistanis | 80.5 /100 | #134 | Excellent 5.2% |
| Immigrants | Saudi Arabia | 80.1 /100 | #135 | Excellent 5.2% |
| Lebanese | 79.9 /100 | #136 | Good 5.2% |
| Immigrants | Eastern Africa | 79.8 /100 | #137 | Good 5.2% |
| Immigrants | Croatia | 79.7 /100 | #138 | Good 5.2% |
| Kenyans | 79.4 /100 | #139 | Good 5.2% |
| Brazilians | 79.3 /100 | #140 | Good 5.2% |
| Immigrants | Switzerland | 79.2 /100 | #141 | Good 5.2% |
| Fijians | 78.3 /100 | #142 | Good 5.2% |
| Syrians | 78.0 /100 | #143 | Good 5.2% |
| Sri Lankans | 77.9 /100 | #144 | Good 5.2% |