Taiwanese vs French American Indian Male Unemployment
COMPARE
Taiwanese
French American Indian
Male Unemployment
Male Unemployment Comparison
Taiwanese
French American Indians
5.3%
MALE UNEMPLOYMENT
37.6/ 100
METRIC RATING
183rd/ 347
METRIC RANK
5.9%
MALE UNEMPLOYMENT
0.0/ 100
METRIC RATING
265th/ 347
METRIC RANK
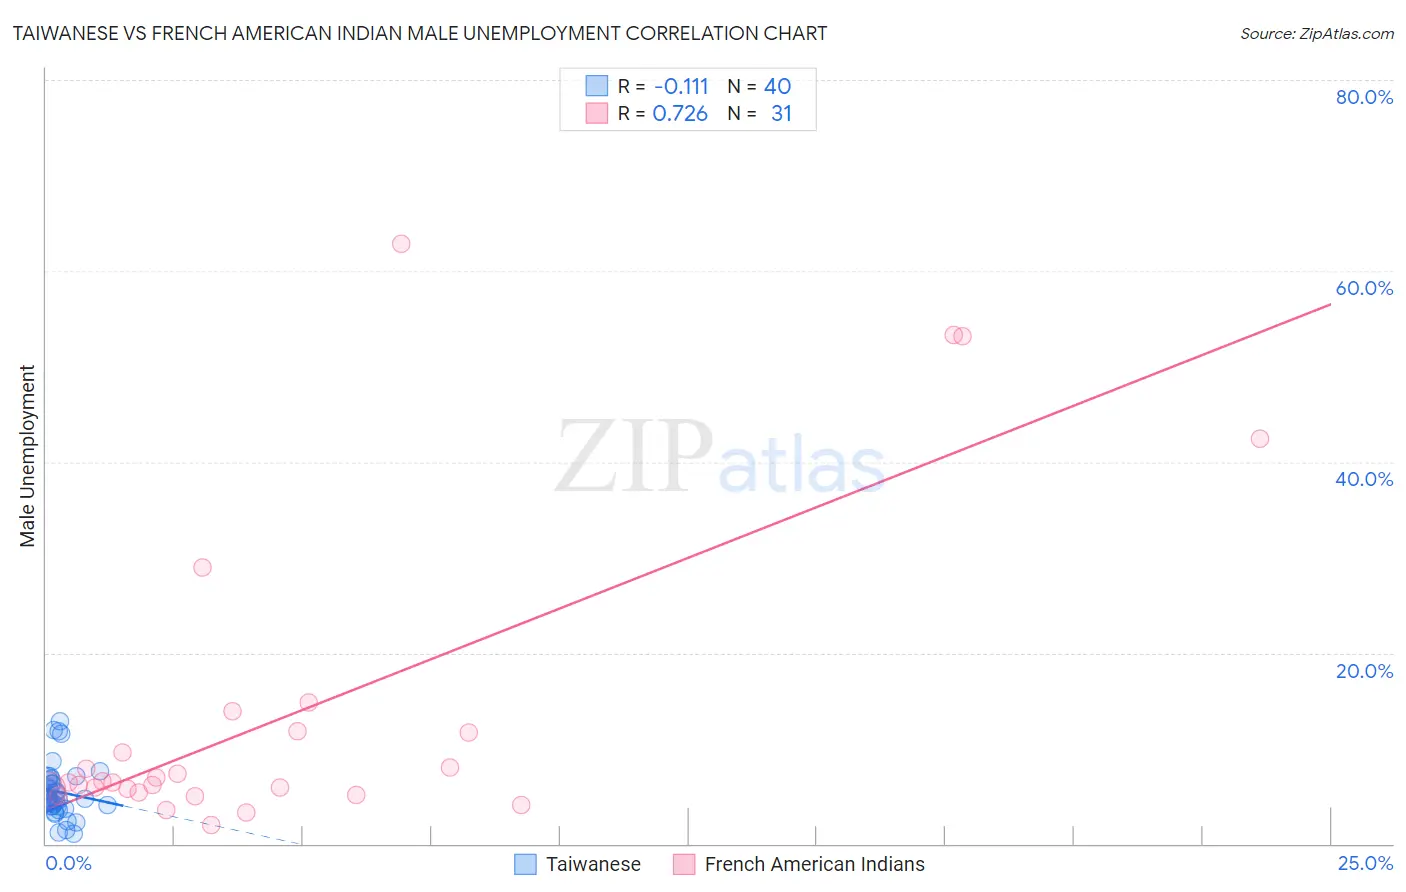
Taiwanese vs French American Indian Male Unemployment Correlation Chart
The statistical analysis conducted on geographies consisting of 31,713,095 people shows a poor negative correlation between the proportion of Taiwanese and unemployment rate among males in the United States with a correlation coefficient (R) of -0.111 and weighted average of 5.3%. Similarly, the statistical analysis conducted on geographies consisting of 131,648,620 people shows a strong positive correlation between the proportion of French American Indians and unemployment rate among males in the United States with a correlation coefficient (R) of 0.726 and weighted average of 5.9%, a difference of 10.8%.
Male Unemployment Correlation Summary
| Measurement | Taiwanese | French American Indian |
| Minimum | 1.1% | 1.9% |
| Maximum | 12.8% | 62.9% |
| Range | 11.7% | 61.0% |
| Mean | 5.4% | 13.6% |
| Median | 4.7% | 6.4% |
| Interquartile 25% (IQ1) | 3.9% | 5.4% |
| Interquartile 75% (IQ3) | 6.7% | 11.8% |
| Interquartile Range (IQR) | 2.9% | 6.4% |
| Standard Deviation (Sample) | 2.8% | 16.4% |
| Standard Deviation (Population) | 2.8% | 16.1% |
Similar Demographics by Male Unemployment
Demographics Similar to Taiwanese by Male Unemployment
In terms of male unemployment, the demographic groups most similar to Taiwanese are Potawatomi (5.3%, a difference of 0.010%), Immigrants from Afghanistan (5.3%, a difference of 0.020%), Malaysian (5.3%, a difference of 0.12%), Spaniard (5.3%, a difference of 0.16%), and Korean (5.3%, a difference of 0.17%).
| Demographics | Rating | Rank | Male Unemployment |
| Immigrants | Poland | 46.0 /100 | #176 | Average 5.3% |
| Immigrants | Peru | 44.6 /100 | #177 | Average 5.3% |
| Osage | 42.5 /100 | #178 | Average 5.3% |
| Immigrants | Oceania | 40.8 /100 | #179 | Average 5.3% |
| Malaysians | 39.6 /100 | #180 | Fair 5.3% |
| Immigrants | Afghanistan | 37.9 /100 | #181 | Fair 5.3% |
| Potawatomi | 37.8 /100 | #182 | Fair 5.3% |
| Taiwanese | 37.6 /100 | #183 | Fair 5.3% |
| Spaniards | 35.1 /100 | #184 | Fair 5.3% |
| Koreans | 34.9 /100 | #185 | Fair 5.3% |
| Iraqis | 31.6 /100 | #186 | Fair 5.4% |
| Costa Ricans | 31.3 /100 | #187 | Fair 5.4% |
| Arabs | 30.2 /100 | #188 | Fair 5.4% |
| Immigrants | South America | 29.4 /100 | #189 | Fair 5.4% |
| Immigrants | Uganda | 28.8 /100 | #190 | Fair 5.4% |
Demographics Similar to French American Indians by Male Unemployment
In terms of male unemployment, the demographic groups most similar to French American Indians are Bahamian (5.9%, a difference of 0.14%), Nigerian (5.9%, a difference of 0.26%), Immigrants from Mexico (5.9%, a difference of 0.39%), Bermudan (5.9%, a difference of 0.47%), and Immigrants from Latin America (5.9%, a difference of 0.61%).
| Demographics | Rating | Rank | Male Unemployment |
| Dutch West Indians | 0.1 /100 | #258 | Tragic 5.8% |
| Cajuns | 0.1 /100 | #259 | Tragic 5.8% |
| Immigrants | Central America | 0.1 /100 | #260 | Tragic 5.8% |
| Liberians | 0.1 /100 | #261 | Tragic 5.8% |
| Immigrants | Portugal | 0.1 /100 | #262 | Tragic 5.9% |
| Immigrants | Latin America | 0.1 /100 | #263 | Tragic 5.9% |
| Immigrants | Mexico | 0.0 /100 | #264 | Tragic 5.9% |
| French American Indians | 0.0 /100 | #265 | Tragic 5.9% |
| Bahamians | 0.0 /100 | #266 | Tragic 5.9% |
| Nigerians | 0.0 /100 | #267 | Tragic 5.9% |
| Bermudans | 0.0 /100 | #268 | Tragic 5.9% |
| Immigrants | Nigeria | 0.0 /100 | #269 | Tragic 6.0% |
| Sub-Saharan Africans | 0.0 /100 | #270 | Tragic 6.0% |
| Blackfeet | 0.0 /100 | #271 | Tragic 6.0% |
| Immigrants | Uzbekistan | 0.0 /100 | #272 | Tragic 6.0% |