Immigrants from Austria vs French American Indian Male Unemployment
COMPARE
Immigrants from Austria
French American Indian
Male Unemployment
Male Unemployment Comparison
Immigrants from Austria
French American Indians
5.1%
MALE UNEMPLOYMENT
90.3/ 100
METRIC RATING
113th/ 347
METRIC RANK
5.9%
MALE UNEMPLOYMENT
0.0/ 100
METRIC RATING
265th/ 347
METRIC RANK
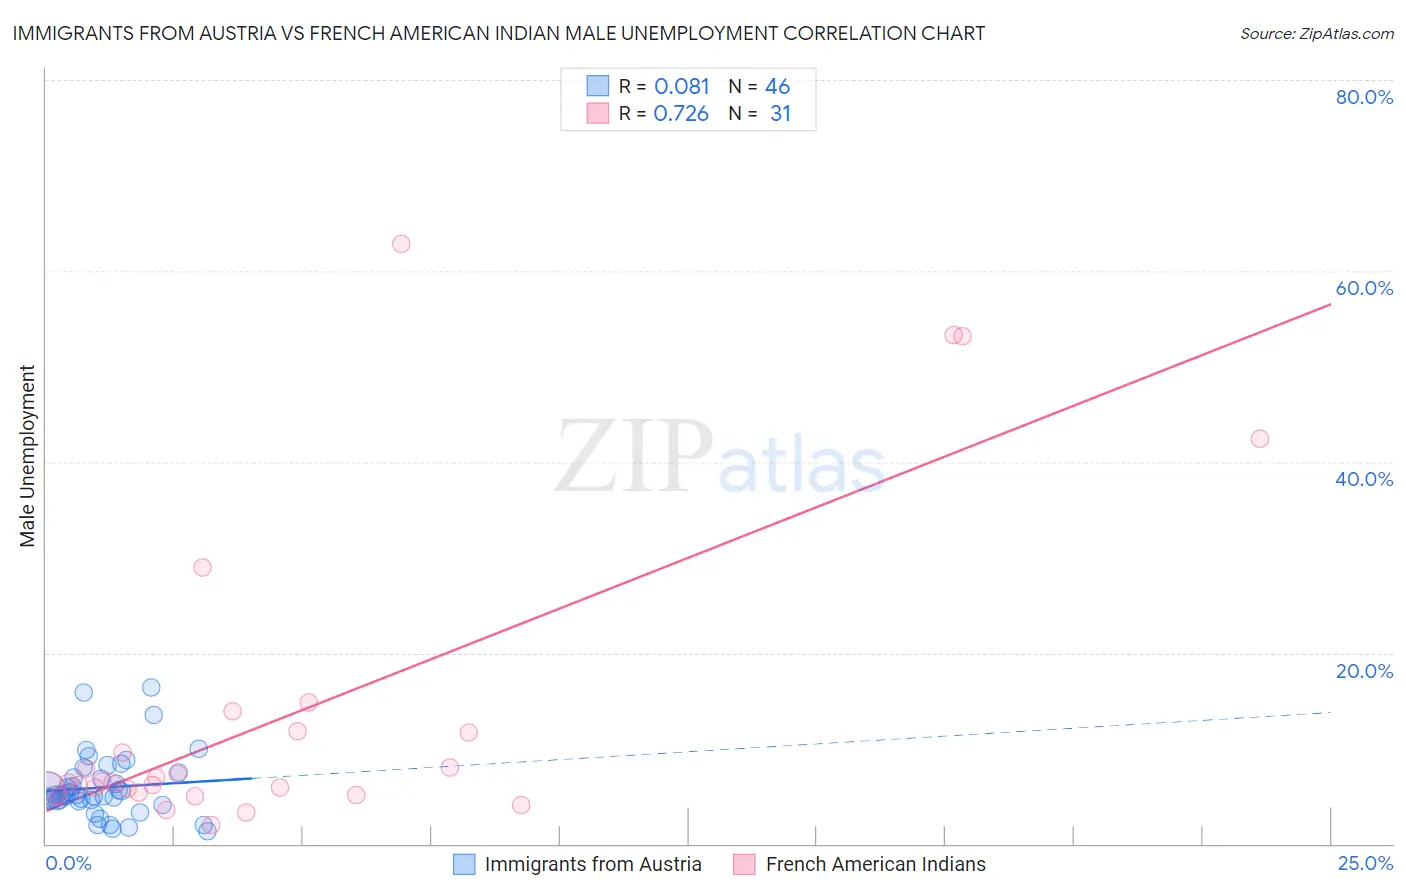
Immigrants from Austria vs French American Indian Male Unemployment Correlation Chart
The statistical analysis conducted on geographies consisting of 167,645,356 people shows a slight positive correlation between the proportion of Immigrants from Austria and unemployment rate among males in the United States with a correlation coefficient (R) of 0.081 and weighted average of 5.1%. Similarly, the statistical analysis conducted on geographies consisting of 131,648,620 people shows a strong positive correlation between the proportion of French American Indians and unemployment rate among males in the United States with a correlation coefficient (R) of 0.726 and weighted average of 5.9%, a difference of 15.3%.
Male Unemployment Correlation Summary
| Measurement | Immigrants from Austria | French American Indian |
| Minimum | 1.3% | 1.9% |
| Maximum | 16.4% | 62.9% |
| Range | 15.1% | 61.0% |
| Mean | 5.9% | 13.6% |
| Median | 5.2% | 6.4% |
| Interquartile 25% (IQ1) | 4.5% | 5.4% |
| Interquartile 75% (IQ3) | 7.0% | 11.8% |
| Interquartile Range (IQR) | 2.5% | 6.4% |
| Standard Deviation (Sample) | 3.3% | 16.4% |
| Standard Deviation (Population) | 3.3% | 16.1% |
Similar Demographics by Male Unemployment
Demographics Similar to Immigrants from Austria by Male Unemployment
In terms of male unemployment, the demographic groups most similar to Immigrants from Austria are Immigrants from Moldova (5.1%, a difference of 0.010%), Romanian (5.1%, a difference of 0.080%), Immigrants from Eastern Asia (5.1%, a difference of 0.090%), Immigrants from England (5.1%, a difference of 0.10%), and Immigrants from Asia (5.1%, a difference of 0.11%).
| Demographics | Rating | Rank | Male Unemployment |
| Immigrants | Ethiopia | 91.5 /100 | #106 | Exceptional 5.1% |
| Ethiopians | 91.3 /100 | #107 | Exceptional 5.1% |
| Immigrants | Nicaragua | 91.2 /100 | #108 | Exceptional 5.1% |
| Immigrants | Pakistan | 90.9 /100 | #109 | Exceptional 5.1% |
| Immigrants | England | 90.8 /100 | #110 | Exceptional 5.1% |
| Immigrants | Eastern Asia | 90.8 /100 | #111 | Exceptional 5.1% |
| Immigrants | Moldova | 90.3 /100 | #112 | Exceptional 5.1% |
| Immigrants | Austria | 90.3 /100 | #113 | Exceptional 5.1% |
| Romanians | 89.8 /100 | #114 | Excellent 5.1% |
| Immigrants | Asia | 89.6 /100 | #115 | Excellent 5.1% |
| Immigrants | Denmark | 89.4 /100 | #116 | Excellent 5.1% |
| Estonians | 89.0 /100 | #117 | Excellent 5.1% |
| Cypriots | 88.8 /100 | #118 | Excellent 5.1% |
| French Canadians | 88.6 /100 | #119 | Excellent 5.1% |
| Ukrainians | 88.4 /100 | #120 | Excellent 5.1% |
Demographics Similar to French American Indians by Male Unemployment
In terms of male unemployment, the demographic groups most similar to French American Indians are Bahamian (5.9%, a difference of 0.14%), Nigerian (5.9%, a difference of 0.26%), Immigrants from Mexico (5.9%, a difference of 0.39%), Bermudan (5.9%, a difference of 0.47%), and Immigrants from Latin America (5.9%, a difference of 0.61%).
| Demographics | Rating | Rank | Male Unemployment |
| Dutch West Indians | 0.1 /100 | #258 | Tragic 5.8% |
| Cajuns | 0.1 /100 | #259 | Tragic 5.8% |
| Immigrants | Central America | 0.1 /100 | #260 | Tragic 5.8% |
| Liberians | 0.1 /100 | #261 | Tragic 5.8% |
| Immigrants | Portugal | 0.1 /100 | #262 | Tragic 5.9% |
| Immigrants | Latin America | 0.1 /100 | #263 | Tragic 5.9% |
| Immigrants | Mexico | 0.0 /100 | #264 | Tragic 5.9% |
| French American Indians | 0.0 /100 | #265 | Tragic 5.9% |
| Bahamians | 0.0 /100 | #266 | Tragic 5.9% |
| Nigerians | 0.0 /100 | #267 | Tragic 5.9% |
| Bermudans | 0.0 /100 | #268 | Tragic 5.9% |
| Immigrants | Nigeria | 0.0 /100 | #269 | Tragic 6.0% |
| Sub-Saharan Africans | 0.0 /100 | #270 | Tragic 6.0% |
| Blackfeet | 0.0 /100 | #271 | Tragic 6.0% |
| Immigrants | Uzbekistan | 0.0 /100 | #272 | Tragic 6.0% |