Paiute vs French American Indian Male Unemployment
COMPARE
Paiute
French American Indian
Male Unemployment
Male Unemployment Comparison
Paiute
French American Indians
7.7%
MALE UNEMPLOYMENT
0.0/ 100
METRIC RATING
327th/ 347
METRIC RANK
5.9%
MALE UNEMPLOYMENT
0.0/ 100
METRIC RATING
265th/ 347
METRIC RANK
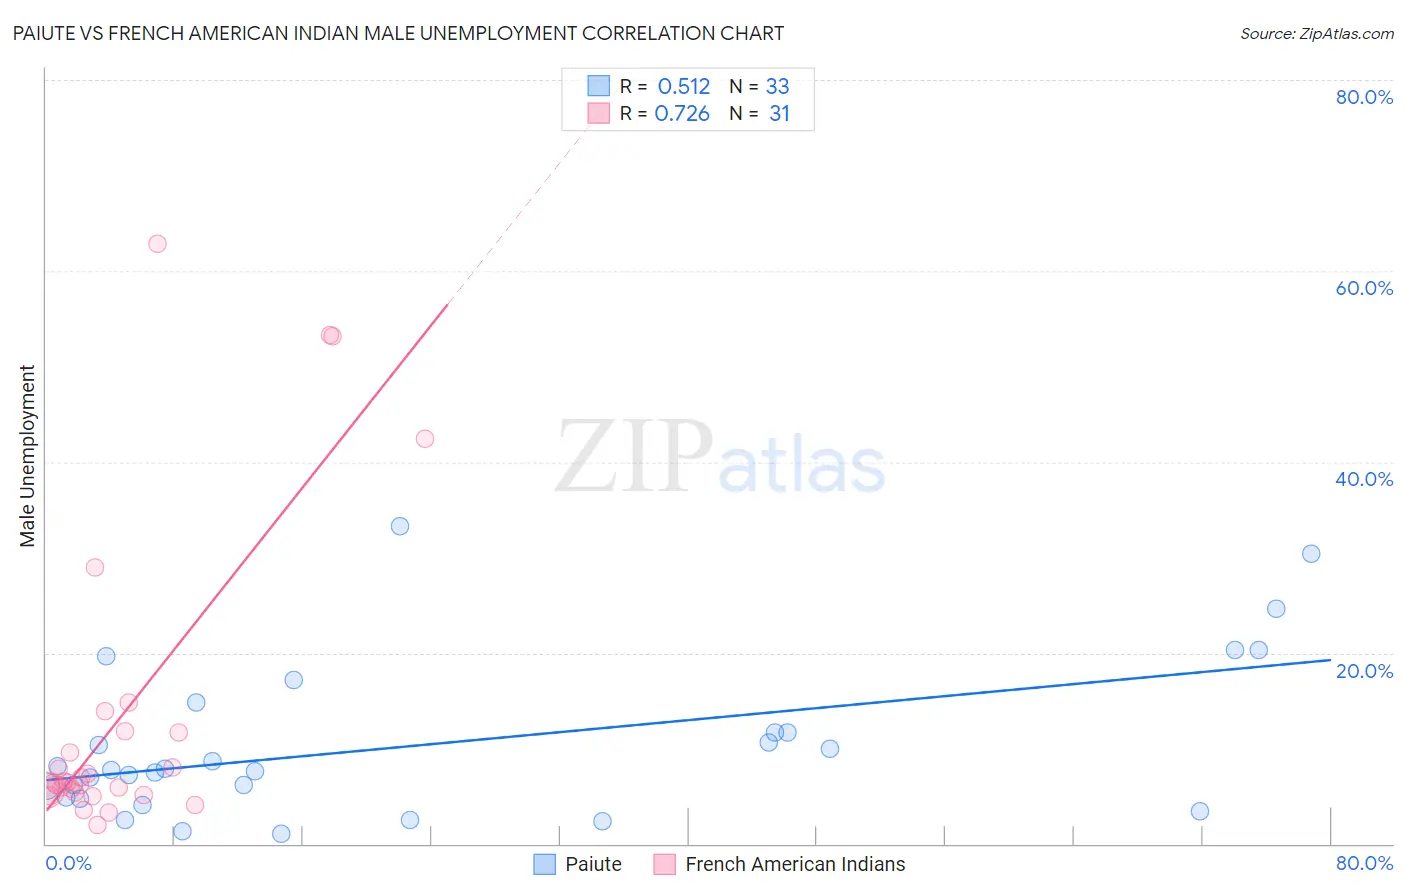
Paiute vs French American Indian Male Unemployment Correlation Chart
The statistical analysis conducted on geographies consisting of 58,346,230 people shows a substantial positive correlation between the proportion of Paiute and unemployment rate among males in the United States with a correlation coefficient (R) of 0.512 and weighted average of 7.7%. Similarly, the statistical analysis conducted on geographies consisting of 131,648,620 people shows a strong positive correlation between the proportion of French American Indians and unemployment rate among males in the United States with a correlation coefficient (R) of 0.726 and weighted average of 5.9%, a difference of 30.1%.
Male Unemployment Correlation Summary
| Measurement | Paiute | French American Indian |
| Minimum | 1.0% | 1.9% |
| Maximum | 33.3% | 62.9% |
| Range | 32.3% | 61.0% |
| Mean | 10.4% | 13.6% |
| Median | 7.8% | 6.4% |
| Interquartile 25% (IQ1) | 4.8% | 5.4% |
| Interquartile 75% (IQ3) | 13.3% | 11.8% |
| Interquartile Range (IQR) | 8.5% | 6.4% |
| Standard Deviation (Sample) | 8.1% | 16.4% |
| Standard Deviation (Population) | 8.0% | 16.1% |
Similar Demographics by Male Unemployment
Demographics Similar to Paiute by Male Unemployment
In terms of male unemployment, the demographic groups most similar to Paiute are Native/Alaskan (7.7%, a difference of 0.38%), Immigrants from Dominican Republic (7.6%, a difference of 1.1%), Shoshone (7.6%, a difference of 1.2%), Immigrants from Yemen (7.8%, a difference of 1.3%), and Dominican (7.6%, a difference of 1.6%).
| Demographics | Rating | Rank | Male Unemployment |
| Colville | 0.0 /100 | #320 | Tragic 7.4% |
| Immigrants | St. Vincent and the Grenadines | 0.0 /100 | #321 | Tragic 7.5% |
| Immigrants | Cabo Verde | 0.0 /100 | #322 | Tragic 7.5% |
| Immigrants | Grenada | 0.0 /100 | #323 | Tragic 7.6% |
| Dominicans | 0.0 /100 | #324 | Tragic 7.6% |
| Shoshone | 0.0 /100 | #325 | Tragic 7.6% |
| Immigrants | Dominican Republic | 0.0 /100 | #326 | Tragic 7.6% |
| Paiute | 0.0 /100 | #327 | Tragic 7.7% |
| Natives/Alaskans | 0.0 /100 | #328 | Tragic 7.7% |
| Immigrants | Yemen | 0.0 /100 | #329 | Tragic 7.8% |
| Yakama | 0.0 /100 | #330 | Tragic 7.9% |
| Alaska Natives | 0.0 /100 | #331 | Tragic 8.1% |
| Pima | 0.0 /100 | #332 | Tragic 8.3% |
| Sioux | 0.0 /100 | #333 | Tragic 8.4% |
| Tsimshian | 0.0 /100 | #334 | Tragic 8.5% |
Demographics Similar to French American Indians by Male Unemployment
In terms of male unemployment, the demographic groups most similar to French American Indians are Bahamian (5.9%, a difference of 0.14%), Nigerian (5.9%, a difference of 0.26%), Immigrants from Mexico (5.9%, a difference of 0.39%), Bermudan (5.9%, a difference of 0.47%), and Immigrants from Latin America (5.9%, a difference of 0.61%).
| Demographics | Rating | Rank | Male Unemployment |
| Dutch West Indians | 0.1 /100 | #258 | Tragic 5.8% |
| Cajuns | 0.1 /100 | #259 | Tragic 5.8% |
| Immigrants | Central America | 0.1 /100 | #260 | Tragic 5.8% |
| Liberians | 0.1 /100 | #261 | Tragic 5.8% |
| Immigrants | Portugal | 0.1 /100 | #262 | Tragic 5.9% |
| Immigrants | Latin America | 0.1 /100 | #263 | Tragic 5.9% |
| Immigrants | Mexico | 0.0 /100 | #264 | Tragic 5.9% |
| French American Indians | 0.0 /100 | #265 | Tragic 5.9% |
| Bahamians | 0.0 /100 | #266 | Tragic 5.9% |
| Nigerians | 0.0 /100 | #267 | Tragic 5.9% |
| Bermudans | 0.0 /100 | #268 | Tragic 5.9% |
| Immigrants | Nigeria | 0.0 /100 | #269 | Tragic 6.0% |
| Sub-Saharan Africans | 0.0 /100 | #270 | Tragic 6.0% |
| Blackfeet | 0.0 /100 | #271 | Tragic 6.0% |
| Immigrants | Uzbekistan | 0.0 /100 | #272 | Tragic 6.0% |