Zimbabwean vs Cheyenne Householder Income Ages 45 - 64 years
COMPARE
Zimbabwean
Cheyenne
Householder Income Ages 45 - 64 years
Householder Income Ages 45 - 64 years Comparison
Zimbabweans
Cheyenne
$106,849
HOUSEHOLDER INCOME AGES 45 - 64 YEARS
96.3/ 100
METRIC RATING
108th/ 347
METRIC RANK
$76,362
HOUSEHOLDER INCOME AGES 45 - 64 YEARS
0.0/ 100
METRIC RATING
335th/ 347
METRIC RANK
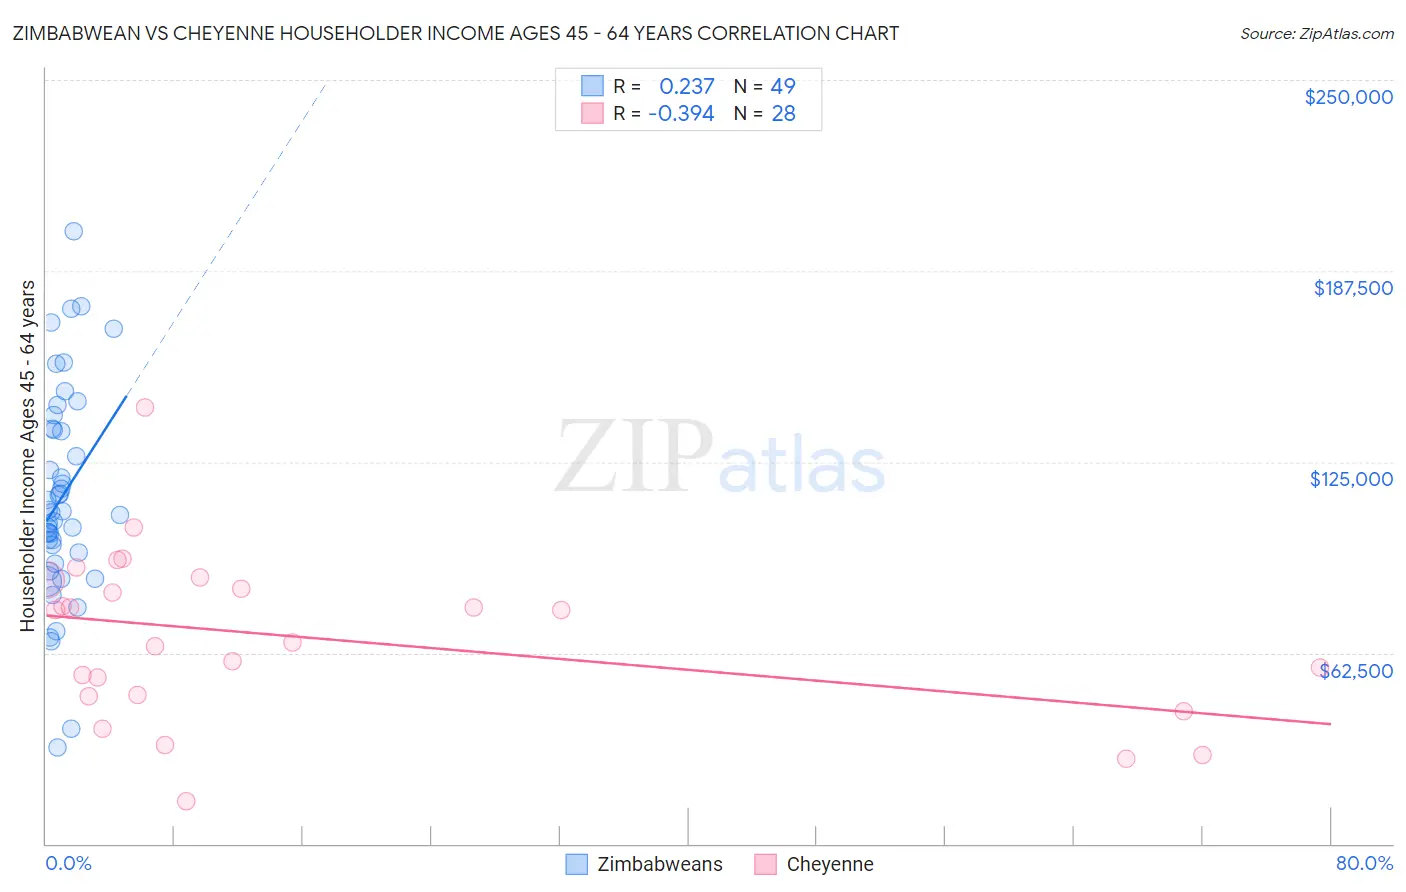
Zimbabwean vs Cheyenne Householder Income Ages 45 - 64 years Correlation Chart
The statistical analysis conducted on geographies consisting of 69,179,320 people shows a weak positive correlation between the proportion of Zimbabweans and household income with householder between the ages 45 and 64 in the United States with a correlation coefficient (R) of 0.237 and weighted average of $106,849. Similarly, the statistical analysis conducted on geographies consisting of 80,666,716 people shows a mild negative correlation between the proportion of Cheyenne and household income with householder between the ages 45 and 64 in the United States with a correlation coefficient (R) of -0.394 and weighted average of $76,362, a difference of 39.9%.
Householder Income Ages 45 - 64 years Correlation Summary
| Measurement | Zimbabwean | Cheyenne |
| Minimum | $31,641 | $13,750 |
| Maximum | $200,450 | $142,727 |
| Range | $168,809 | $128,977 |
| Mean | $113,309 | $67,332 |
| Median | $108,283 | $71,250 |
| Interquartile 25% (IQ1) | $93,481 | $48,460 |
| Interquartile 75% (IQ3) | $135,585 | $84,816 |
| Interquartile Range (IQR) | $42,104 | $36,356 |
| Standard Deviation (Sample) | $34,490 | $27,465 |
| Standard Deviation (Population) | $34,136 | $26,970 |
Similar Demographics by Householder Income Ages 45 - 64 years
Demographics Similar to Zimbabweans by Householder Income Ages 45 - 64 years
In terms of householder income ages 45 - 64 years, the demographic groups most similar to Zimbabweans are Immigrants from Fiji ($106,952, a difference of 0.10%), Armenian ($107,002, a difference of 0.14%), Macedonian ($107,074, a difference of 0.21%), Immigrants from Ukraine ($107,079, a difference of 0.22%), and Chilean ($106,611, a difference of 0.22%).
| Demographics | Rating | Rank | Householder Income Ages 45 - 64 years |
| Immigrants | Kazakhstan | 97.2 /100 | #101 | Exceptional $107,378 |
| Immigrants | Moldova | 97.1 /100 | #102 | Exceptional $107,357 |
| Syrians | 96.9 /100 | #103 | Exceptional $107,207 |
| Immigrants | Ukraine | 96.7 /100 | #104 | Exceptional $107,079 |
| Macedonians | 96.7 /100 | #105 | Exceptional $107,074 |
| Armenians | 96.6 /100 | #106 | Exceptional $107,002 |
| Immigrants | Fiji | 96.5 /100 | #107 | Exceptional $106,952 |
| Zimbabweans | 96.3 /100 | #108 | Exceptional $106,849 |
| Chileans | 95.9 /100 | #109 | Exceptional $106,611 |
| Immigrants | Brazil | 95.6 /100 | #110 | Exceptional $106,470 |
| Immigrants | Vietnam | 95.5 /100 | #111 | Exceptional $106,417 |
| Swedes | 95.4 /100 | #112 | Exceptional $106,377 |
| Europeans | 95.4 /100 | #113 | Exceptional $106,367 |
| Immigrants | Poland | 95.3 /100 | #114 | Exceptional $106,319 |
| Immigrants | Kuwait | 95.2 /100 | #115 | Exceptional $106,285 |
Demographics Similar to Cheyenne by Householder Income Ages 45 - 64 years
In terms of householder income ages 45 - 64 years, the demographic groups most similar to Cheyenne are Arapaho ($75,945, a difference of 0.55%), Menominee ($76,903, a difference of 0.71%), Pueblo ($75,601, a difference of 1.0%), Hopi ($75,562, a difference of 1.1%), and Immigrants from Congo ($77,850, a difference of 1.9%).
| Demographics | Rating | Rank | Householder Income Ages 45 - 64 years |
| Natives/Alaskans | 0.0 /100 | #328 | Tragic $79,816 |
| Dutch West Indians | 0.0 /100 | #329 | Tragic $79,171 |
| Creek | 0.0 /100 | #330 | Tragic $78,960 |
| Immigrants | Dominican Republic | 0.0 /100 | #331 | Tragic $78,836 |
| Blacks/African Americans | 0.0 /100 | #332 | Tragic $78,556 |
| Immigrants | Congo | 0.0 /100 | #333 | Tragic $77,850 |
| Menominee | 0.0 /100 | #334 | Tragic $76,903 |
| Cheyenne | 0.0 /100 | #335 | Tragic $76,362 |
| Arapaho | 0.0 /100 | #336 | Tragic $75,945 |
| Pueblo | 0.0 /100 | #337 | Tragic $75,601 |
| Hopi | 0.0 /100 | #338 | Tragic $75,562 |
| Kiowa | 0.0 /100 | #339 | Tragic $74,815 |
| Immigrants | Yemen | 0.0 /100 | #340 | Tragic $74,575 |
| Crow | 0.0 /100 | #341 | Tragic $74,257 |
| Tohono O'odham | 0.0 /100 | #342 | Tragic $73,774 |