Zimbabwean vs Cheyenne Master's Degree
COMPARE
Zimbabwean
Cheyenne
Master's Degree
Master's Degree Comparison
Zimbabweans
Cheyenne
17.7%
MASTER'S DEGREE
99.7/ 100
METRIC RATING
73rd/ 347
METRIC RANK
11.2%
MASTER'S DEGREE
0.0/ 100
METRIC RATING
307th/ 347
METRIC RANK
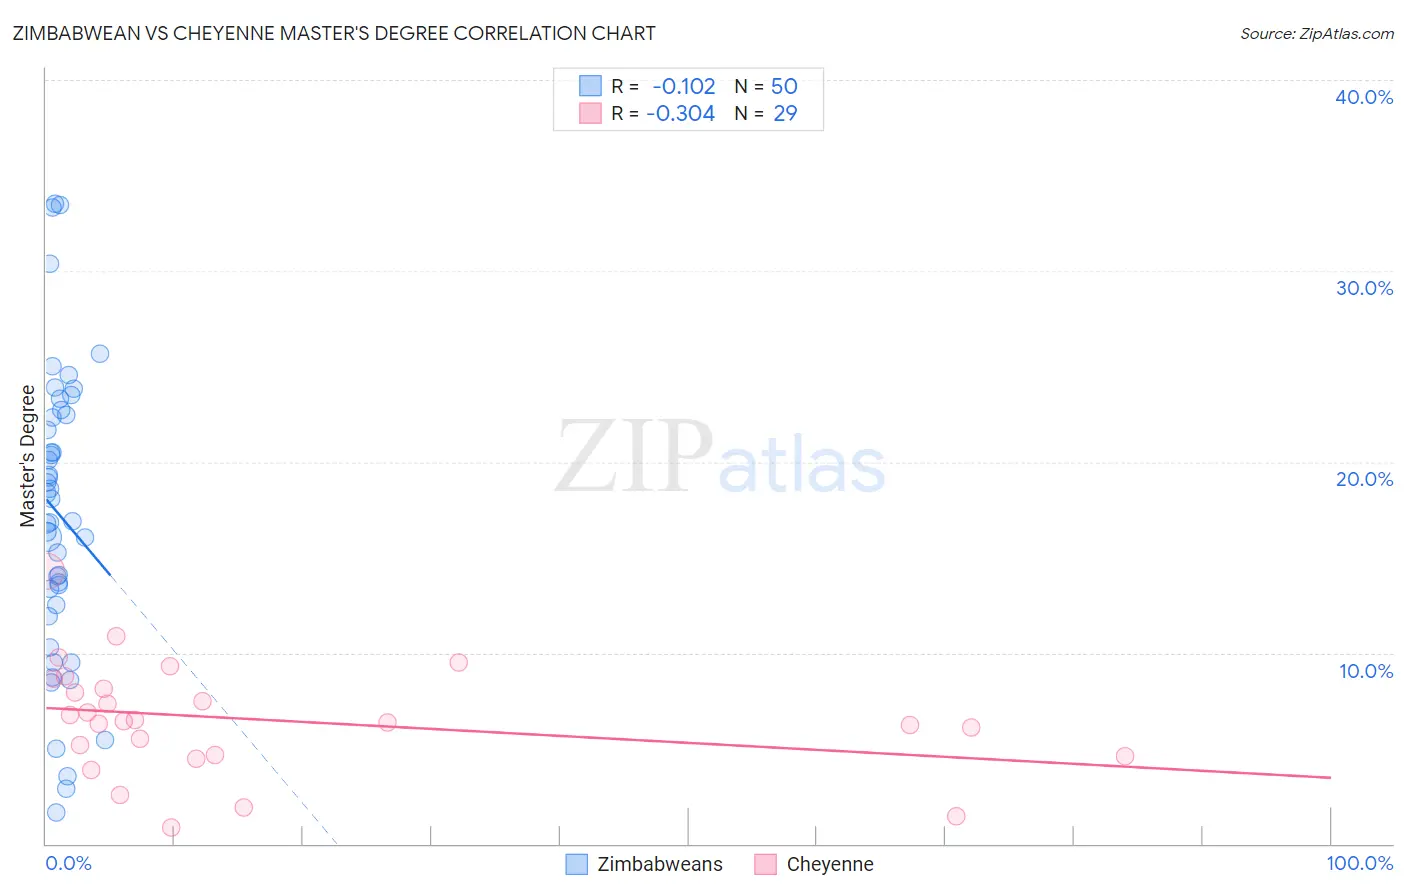
Zimbabwean vs Cheyenne Master's Degree Correlation Chart
The statistical analysis conducted on geographies consisting of 69,201,212 people shows a poor negative correlation between the proportion of Zimbabweans and percentage of population with at least master's degree education in the United States with a correlation coefficient (R) of -0.102 and weighted average of 17.7%. Similarly, the statistical analysis conducted on geographies consisting of 80,705,312 people shows a mild negative correlation between the proportion of Cheyenne and percentage of population with at least master's degree education in the United States with a correlation coefficient (R) of -0.304 and weighted average of 11.2%, a difference of 57.8%.
Master's Degree Correlation Summary
| Measurement | Zimbabwean | Cheyenne |
| Minimum | 1.7% | 0.84% |
| Maximum | 33.5% | 14.3% |
| Range | 31.8% | 13.5% |
| Mean | 17.3% | 6.5% |
| Median | 17.5% | 6.4% |
| Interquartile 25% (IQ1) | 12.5% | 4.6% |
| Interquartile 75% (IQ3) | 22.4% | 8.4% |
| Interquartile Range (IQR) | 9.9% | 3.8% |
| Standard Deviation (Sample) | 7.7% | 2.9% |
| Standard Deviation (Population) | 7.6% | 2.9% |
Similar Demographics by Master's Degree
Demographics Similar to Zimbabweans by Master's Degree
In terms of master's degree, the demographic groups most similar to Zimbabweans are Lithuanian (17.7%, a difference of 0.11%), Immigrants from Pakistan (17.8%, a difference of 0.28%), Immigrants from Romania (17.7%, a difference of 0.31%), Immigrants from Western Europe (17.8%, a difference of 0.57%), and Egyptian (17.6%, a difference of 0.69%).
| Demographics | Rating | Rank | Master's Degree |
| Ethiopians | 99.8 /100 | #66 | Exceptional 18.0% |
| Immigrants | Argentina | 99.8 /100 | #67 | Exceptional 18.0% |
| Immigrants | Ethiopia | 99.8 /100 | #68 | Exceptional 17.9% |
| Immigrants | Uzbekistan | 99.8 /100 | #69 | Exceptional 17.9% |
| Immigrants | Western Europe | 99.8 /100 | #70 | Exceptional 17.8% |
| Immigrants | Pakistan | 99.7 /100 | #71 | Exceptional 17.8% |
| Lithuanians | 99.7 /100 | #72 | Exceptional 17.7% |
| Zimbabweans | 99.7 /100 | #73 | Exceptional 17.7% |
| Immigrants | Romania | 99.7 /100 | #74 | Exceptional 17.7% |
| Egyptians | 99.6 /100 | #75 | Exceptional 17.6% |
| Immigrants | Indonesia | 99.6 /100 | #76 | Exceptional 17.6% |
| Immigrants | Eastern Europe | 99.6 /100 | #77 | Exceptional 17.6% |
| Immigrants | Hungary | 99.6 /100 | #78 | Exceptional 17.5% |
| Immigrants | Lebanon | 99.6 /100 | #79 | Exceptional 17.5% |
| Carpatho Rusyns | 99.6 /100 | #80 | Exceptional 17.5% |
Demographics Similar to Cheyenne by Master's Degree
In terms of master's degree, the demographic groups most similar to Cheyenne are Mexican American Indian (11.2%, a difference of 0.15%), Immigrants from Latin America (11.3%, a difference of 0.34%), Puerto Rican (11.2%, a difference of 0.55%), Puget Sound Salish (11.1%, a difference of 0.84%), and Immigrants from Cabo Verde (11.3%, a difference of 0.99%).
| Demographics | Rating | Rank | Master's Degree |
| Chippewa | 0.1 /100 | #300 | Tragic 11.4% |
| Tsimshian | 0.1 /100 | #301 | Tragic 11.4% |
| Cherokee | 0.1 /100 | #302 | Tragic 11.4% |
| Immigrants | Laos | 0.1 /100 | #303 | Tragic 11.4% |
| Immigrants | Cabo Verde | 0.1 /100 | #304 | Tragic 11.3% |
| Immigrants | Latin America | 0.0 /100 | #305 | Tragic 11.3% |
| Mexican American Indians | 0.0 /100 | #306 | Tragic 11.2% |
| Cheyenne | 0.0 /100 | #307 | Tragic 11.2% |
| Puerto Ricans | 0.0 /100 | #308 | Tragic 11.2% |
| Puget Sound Salish | 0.0 /100 | #309 | Tragic 11.1% |
| Shoshone | 0.0 /100 | #310 | Tragic 11.1% |
| Seminole | 0.0 /100 | #311 | Tragic 11.0% |
| Choctaw | 0.0 /100 | #312 | Tragic 11.0% |
| Yaqui | 0.0 /100 | #313 | Tragic 11.0% |
| Cajuns | 0.0 /100 | #314 | Tragic 11.0% |