Yup'ik vs Marshallese Vision Disability
COMPARE
Yup'ik
Marshallese
Vision Disability
Vision Disability Comparison
Yup'ik
Marshallese
2.7%
VISION DISABILITY
0.0/ 100
METRIC RATING
317th/ 347
METRIC RANK
2.3%
VISION DISABILITY
1.5/ 100
METRIC RATING
235th/ 347
METRIC RANK
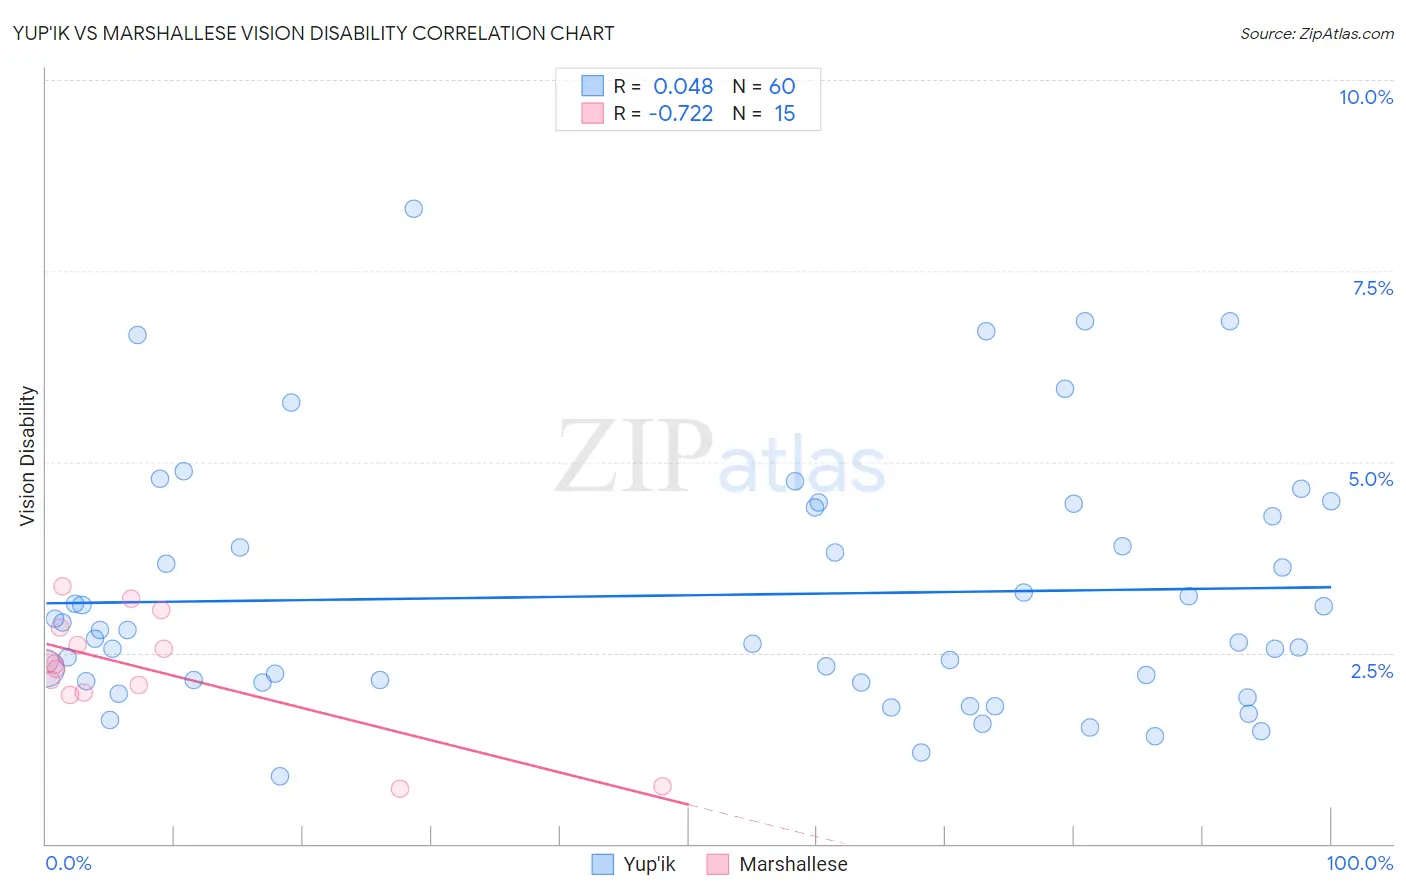
Yup'ik vs Marshallese Vision Disability Correlation Chart
The statistical analysis conducted on geographies consisting of 39,951,250 people shows no correlation between the proportion of Yup'ik and percentage of population with vision disability in the United States with a correlation coefficient (R) of 0.048 and weighted average of 2.7%. Similarly, the statistical analysis conducted on geographies consisting of 14,759,042 people shows a strong negative correlation between the proportion of Marshallese and percentage of population with vision disability in the United States with a correlation coefficient (R) of -0.722 and weighted average of 2.3%, a difference of 16.9%.
Vision Disability Correlation Summary
| Measurement | Yup'ik | Marshallese |
| Minimum | 0.88% | 0.72% |
| Maximum | 8.3% | 3.4% |
| Range | 7.4% | 2.6% |
| Mean | 3.3% | 2.3% |
| Median | 2.7% | 2.4% |
| Interquartile 25% (IQ1) | 2.1% | 2.0% |
| Interquartile 75% (IQ3) | 4.3% | 2.8% |
| Interquartile Range (IQR) | 2.2% | 0.86% |
| Standard Deviation (Sample) | 1.6% | 0.76% |
| Standard Deviation (Population) | 1.6% | 0.74% |
Similar Demographics by Vision Disability
Demographics Similar to Yup'ik by Vision Disability
In terms of vision disability, the demographic groups most similar to Yup'ik are Shoshone (2.7%, a difference of 0.20%), Osage (2.7%, a difference of 0.63%), Alaska Native (2.7%, a difference of 1.1%), Inupiat (2.7%, a difference of 1.8%), and Potawatomi (2.6%, a difference of 1.9%).
| Demographics | Rating | Rank | Vision Disability |
| Blackfeet | 0.0 /100 | #310 | Tragic 2.6% |
| Dominicans | 0.0 /100 | #311 | Tragic 2.6% |
| Americans | 0.0 /100 | #312 | Tragic 2.6% |
| Potawatomi | 0.0 /100 | #313 | Tragic 2.6% |
| Inupiat | 0.0 /100 | #314 | Tragic 2.7% |
| Osage | 0.0 /100 | #315 | Tragic 2.7% |
| Shoshone | 0.0 /100 | #316 | Tragic 2.7% |
| Yup'ik | 0.0 /100 | #317 | Tragic 2.7% |
| Alaska Natives | 0.0 /100 | #318 | Tragic 2.7% |
| Tohono O'odham | 0.0 /100 | #319 | Tragic 2.8% |
| Blacks/African Americans | 0.0 /100 | #320 | Tragic 2.8% |
| Comanche | 0.0 /100 | #321 | Tragic 2.8% |
| Paiute | 0.0 /100 | #322 | Tragic 2.9% |
| Tlingit-Haida | 0.0 /100 | #323 | Tragic 2.9% |
| Hopi | 0.0 /100 | #324 | Tragic 2.9% |
Demographics Similar to Marshallese by Vision Disability
In terms of vision disability, the demographic groups most similar to Marshallese are Scottish (2.3%, a difference of 0.070%), Immigrants from Congo (2.3%, a difference of 0.090%), Immigrants from Portugal (2.3%, a difference of 0.14%), Central American (2.3%, a difference of 0.25%), and German Russian (2.3%, a difference of 0.27%).
| Demographics | Rating | Rank | Vision Disability |
| Hmong | 2.5 /100 | #228 | Tragic 2.3% |
| Welsh | 2.3 /100 | #229 | Tragic 2.3% |
| Nicaraguans | 2.2 /100 | #230 | Tragic 2.3% |
| Immigrants | Ecuador | 2.0 /100 | #231 | Tragic 2.3% |
| German Russians | 1.8 /100 | #232 | Tragic 2.3% |
| Central Americans | 1.8 /100 | #233 | Tragic 2.3% |
| Scottish | 1.6 /100 | #234 | Tragic 2.3% |
| Marshallese | 1.5 /100 | #235 | Tragic 2.3% |
| Immigrants | Congo | 1.4 /100 | #236 | Tragic 2.3% |
| Immigrants | Portugal | 1.4 /100 | #237 | Tragic 2.3% |
| Immigrants | Cambodia | 1.1 /100 | #238 | Tragic 2.3% |
| English | 1.1 /100 | #239 | Tragic 2.3% |
| Panamanians | 0.9 /100 | #240 | Tragic 2.3% |
| Malaysians | 0.9 /100 | #241 | Tragic 2.3% |
| Immigrants | Panama | 0.8 /100 | #242 | Tragic 2.3% |