Yup'ik vs Marshallese Average Family Size
COMPARE
Yup'ik
Marshallese
Average Family Size
Average Family Size Comparison
Yup'ik
Marshallese
4.00
AVERAGE FAMILY SIZE
100/ 100
METRIC RATING
1st/ 347
METRIC RANK
3.38
AVERAGE FAMILY SIZE
100.0/ 100
METRIC RATING
41st/ 347
METRIC RANK
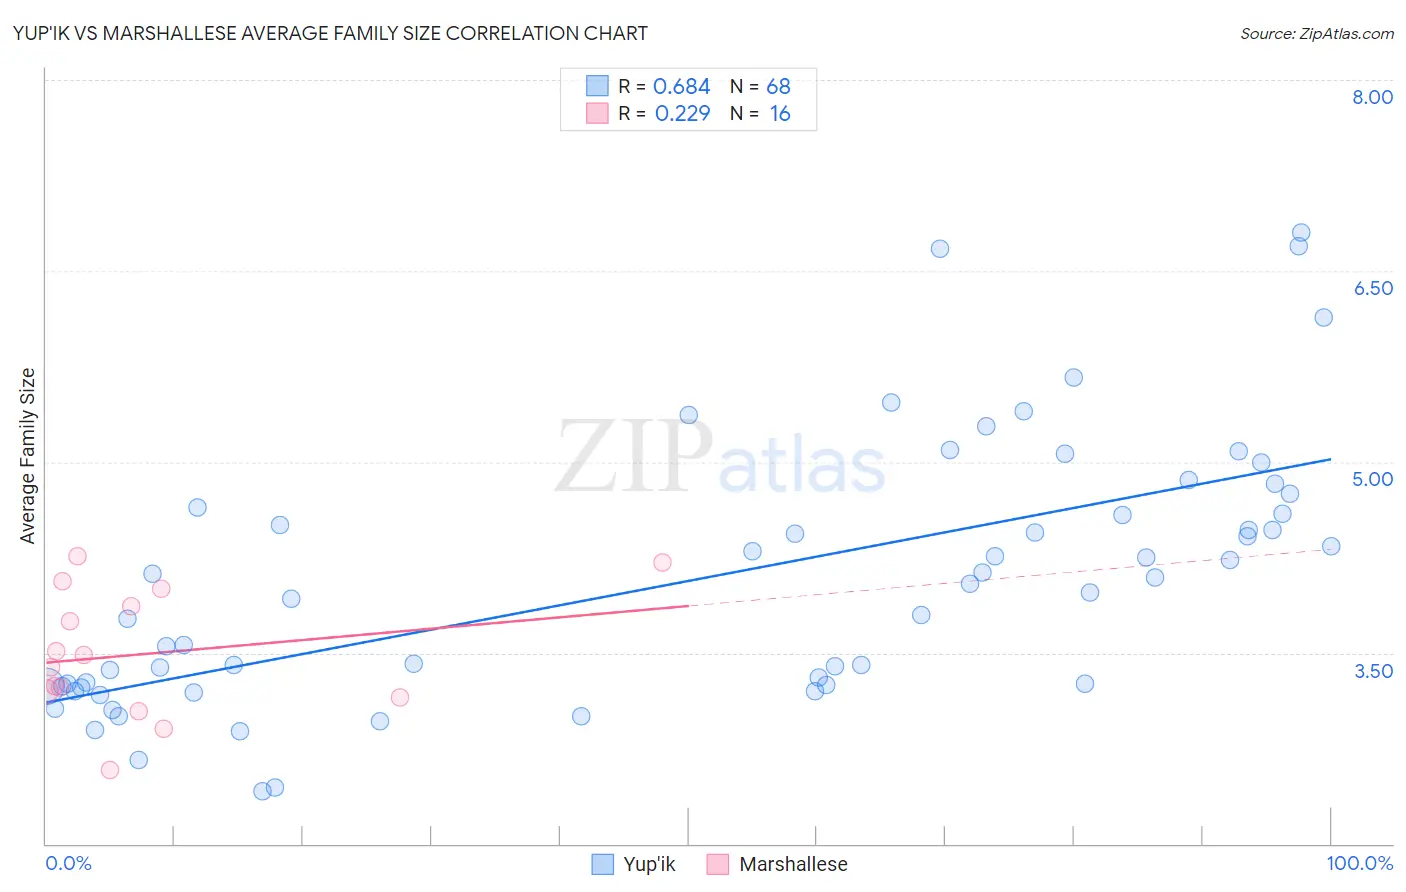
Yup'ik vs Marshallese Average Family Size Correlation Chart
The statistical analysis conducted on geographies consisting of 39,956,738 people shows a significant positive correlation between the proportion of Yup'ik and average family size in the United States with a correlation coefficient (R) of 0.684 and weighted average of 4.00. Similarly, the statistical analysis conducted on geographies consisting of 14,761,315 people shows a weak positive correlation between the proportion of Marshallese and average family size in the United States with a correlation coefficient (R) of 0.229 and weighted average of 3.38, a difference of 18.2%.
Average Family Size Correlation Summary
| Measurement | Yup'ik | Marshallese |
| Minimum | 2.41 | 2.58 |
| Maximum | 6.80 | 4.26 |
| Range | 4.39 | 1.68 |
| Mean | 4.07 | 3.49 |
| Median | 4.01 | 3.43 |
| Interquartile 25% (IQ1) | 3.25 | 3.17 |
| Interquartile 75% (IQ3) | 4.61 | 3.94 |
| Interquartile Range (IQR) | 1.37 | 0.76 |
| Standard Deviation (Sample) | 1.02 | 0.49 |
| Standard Deviation (Population) | 1.01 | 0.48 |
Similar Demographics by Average Family Size
Demographics Similar to Yup'ik by Average Family Size
In terms of average family size, the demographic groups most similar to Yup'ik are Crow (3.82, a difference of 4.5%), Pueblo (3.79, a difference of 5.3%), Pima (3.75, a difference of 6.7%), Navajo (3.65, a difference of 9.6%), and Arapaho (3.64, a difference of 9.9%).
| Demographics | Rating | Rank | Average Family Size |
| Yup'ik | 100 /100 | #1 | Exceptional 4.00 |
| Crow | 100 /100 | #2 | Exceptional 3.82 |
| Pueblo | 100 /100 | #3 | Exceptional 3.79 |
| Pima | 100 /100 | #4 | Exceptional 3.75 |
| Navajo | 100.0 /100 | #5 | Exceptional 3.65 |
| Arapaho | 100.0 /100 | #6 | Exceptional 3.64 |
| Inupiat | 100.0 /100 | #7 | Exceptional 3.63 |
| Immigrants | Yemen | 100.0 /100 | #8 | Exceptional 3.60 |
| Hopi | 100.0 /100 | #9 | Exceptional 3.60 |
| Spanish American Indians | 100.0 /100 | #10 | Exceptional 3.58 |
| Tohono O'odham | 100.0 /100 | #11 | Exceptional 3.53 |
| Immigrants | Mexico | 100.0 /100 | #12 | Exceptional 3.52 |
| Sioux | 100.0 /100 | #13 | Exceptional 3.52 |
| Immigrants | Central America | 100.0 /100 | #14 | Exceptional 3.49 |
| Tongans | 100.0 /100 | #15 | Exceptional 3.49 |
Demographics Similar to Marshallese by Average Family Size
In terms of average family size, the demographic groups most similar to Marshallese are Immigrants from Vietnam (3.38, a difference of 0.060%), Immigrants from Philippines (3.37, a difference of 0.16%), Belizean (3.39, a difference of 0.17%), Alaska Native (3.37, a difference of 0.17%), and Shoshone (3.37, a difference of 0.20%).
| Demographics | Rating | Rank | Average Family Size |
| Hispanics or Latinos | 100.0 /100 | #34 | Exceptional 3.41 |
| Guatemalans | 100.0 /100 | #35 | Exceptional 3.40 |
| Immigrants | Guyana | 100.0 /100 | #36 | Exceptional 3.40 |
| Guyanese | 100.0 /100 | #37 | Exceptional 3.40 |
| Immigrants | Belize | 100.0 /100 | #38 | Exceptional 3.39 |
| Immigrants | Haiti | 100.0 /100 | #39 | Exceptional 3.39 |
| Belizeans | 100.0 /100 | #40 | Exceptional 3.39 |
| Marshallese | 100.0 /100 | #41 | Exceptional 3.38 |
| Immigrants | Vietnam | 100.0 /100 | #42 | Exceptional 3.38 |
| Immigrants | Philippines | 100.0 /100 | #43 | Exceptional 3.37 |
| Alaska Natives | 100.0 /100 | #44 | Exceptional 3.37 |
| Shoshone | 100.0 /100 | #45 | Exceptional 3.37 |
| Haitians | 100.0 /100 | #46 | Exceptional 3.37 |
| Vietnamese | 100.0 /100 | #47 | Exceptional 3.37 |
| Immigrants | Nicaragua | 100.0 /100 | #48 | Exceptional 3.37 |