Immigrants from Eastern Africa vs Marshallese Unemployment Among Ages 30 to 34 years
COMPARE
Immigrants from Eastern Africa
Marshallese
Unemployment Among Ages 30 to 34 years
Unemployment Among Ages 30 to 34 years Comparison
Immigrants from Eastern Africa
Marshallese
5.0%
UNEMPLOYMENT AMONG AGES 30 TO 34 YEARS
98.9/ 100
METRIC RATING
41st/ 347
METRIC RANK
7.2%
UNEMPLOYMENT AMONG AGES 30 TO 34 YEARS
0.0/ 100
METRIC RATING
322nd/ 347
METRIC RANK
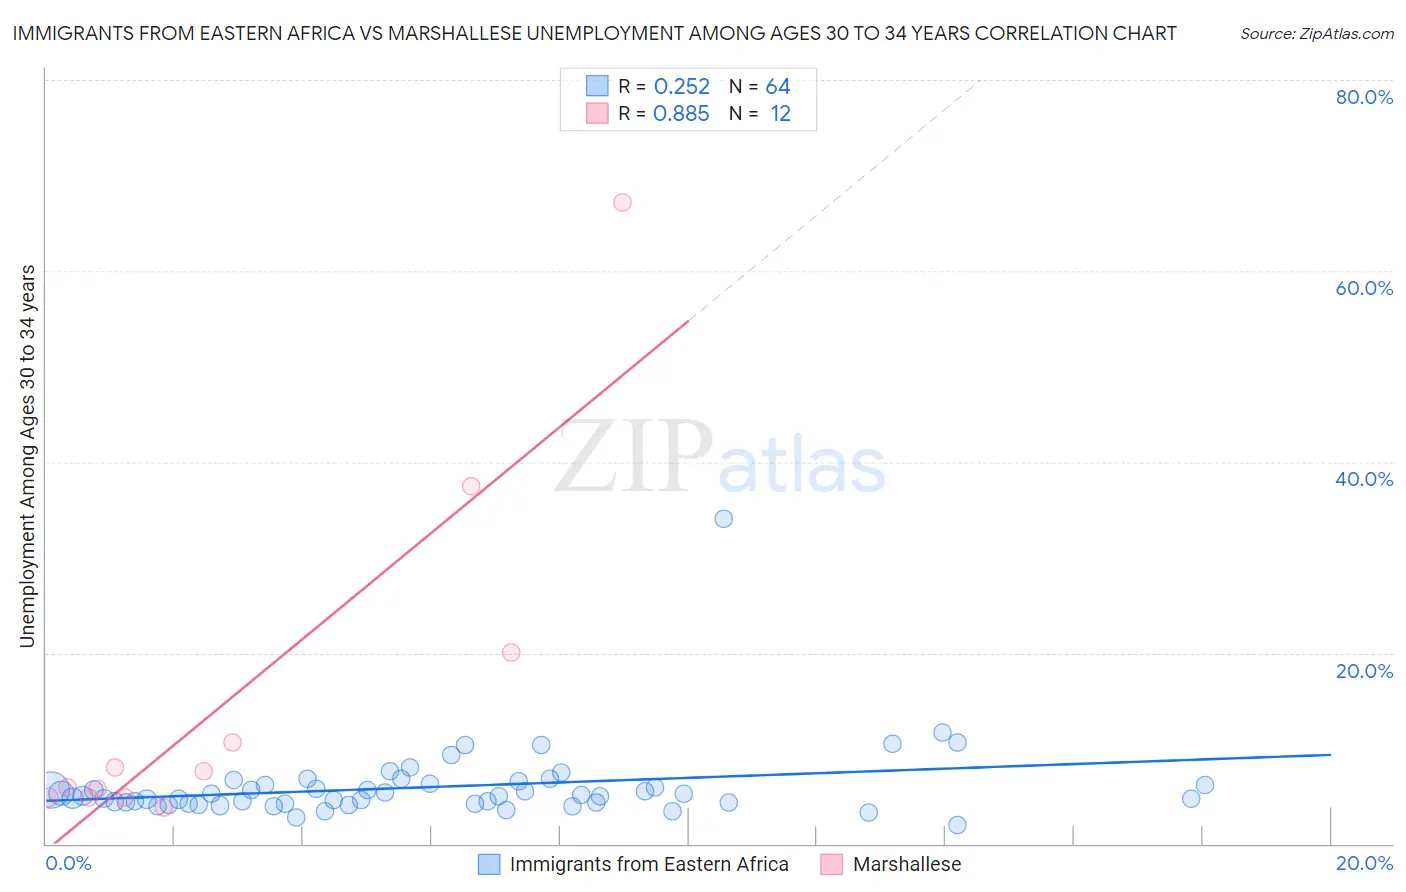
Immigrants from Eastern Africa vs Marshallese Unemployment Among Ages 30 to 34 years Correlation Chart
The statistical analysis conducted on geographies consisting of 339,538,992 people shows a weak positive correlation between the proportion of Immigrants from Eastern Africa and unemployment rate among population between the ages 30 and 34 in the United States with a correlation coefficient (R) of 0.252 and weighted average of 5.0%. Similarly, the statistical analysis conducted on geographies consisting of 14,614,488 people shows a very strong positive correlation between the proportion of Marshallese and unemployment rate among population between the ages 30 and 34 in the United States with a correlation coefficient (R) of 0.885 and weighted average of 7.2%, a difference of 44.0%.
Unemployment Among Ages 30 to 34 years Correlation Summary
| Measurement | Immigrants from Eastern Africa | Marshallese |
| Minimum | 1.9% | 3.8% |
| Maximum | 34.0% | 67.2% |
| Range | 32.1% | 63.4% |
| Mean | 5.9% | 15.1% |
| Median | 5.0% | 6.8% |
| Interquartile 25% (IQ1) | 4.3% | 4.9% |
| Interquartile 75% (IQ3) | 6.2% | 15.3% |
| Interquartile Range (IQR) | 2.0% | 10.4% |
| Standard Deviation (Sample) | 4.1% | 19.0% |
| Standard Deviation (Population) | 4.0% | 18.2% |
Similar Demographics by Unemployment Among Ages 30 to 34 years
Demographics Similar to Immigrants from Eastern Africa by Unemployment Among Ages 30 to 34 years
In terms of unemployment among ages 30 to 34 years, the demographic groups most similar to Immigrants from Eastern Africa are Immigrants from Vietnam (5.0%, a difference of 0.0%), Fijian (5.0%, a difference of 0.080%), Immigrants from Hong Kong (5.0%, a difference of 0.18%), Immigrants from Turkey (5.0%, a difference of 0.19%), and Sri Lankan (5.0%, a difference of 0.19%).
| Demographics | Rating | Rank | Unemployment Among Ages 30 to 34 years |
| Latvians | 99.3 /100 | #34 | Exceptional 5.0% |
| Immigrants | Ethiopia | 99.2 /100 | #35 | Exceptional 5.0% |
| Czechs | 99.2 /100 | #36 | Exceptional 5.0% |
| Immigrants | Turkey | 99.0 /100 | #37 | Exceptional 5.0% |
| Sri Lankans | 99.0 /100 | #38 | Exceptional 5.0% |
| Fijians | 99.0 /100 | #39 | Exceptional 5.0% |
| Immigrants | Vietnam | 98.9 /100 | #40 | Exceptional 5.0% |
| Immigrants | Eastern Africa | 98.9 /100 | #41 | Exceptional 5.0% |
| Immigrants | Hong Kong | 98.8 /100 | #42 | Exceptional 5.0% |
| Soviet Union | 98.8 /100 | #43 | Exceptional 5.0% |
| Immigrants | Belgium | 98.7 /100 | #44 | Exceptional 5.1% |
| Yugoslavians | 98.6 /100 | #45 | Exceptional 5.1% |
| Immigrants | Congo | 98.4 /100 | #46 | Exceptional 5.1% |
| Cypriots | 98.4 /100 | #47 | Exceptional 5.1% |
| Assyrians/Chaldeans/Syriacs | 98.4 /100 | #48 | Exceptional 5.1% |
Demographics Similar to Marshallese by Unemployment Among Ages 30 to 34 years
In terms of unemployment among ages 30 to 34 years, the demographic groups most similar to Marshallese are Immigrants from Yemen (7.3%, a difference of 0.46%), Immigrants from Guyana (7.2%, a difference of 0.50%), Cape Verdean (7.2%, a difference of 0.79%), Guyanese (7.2%, a difference of 0.81%), and Black/African American (7.2%, a difference of 0.88%).
| Demographics | Rating | Rank | Unemployment Among Ages 30 to 34 years |
| Aleuts | 0.0 /100 | #315 | Tragic 7.1% |
| Houma | 0.0 /100 | #316 | Tragic 7.2% |
| Immigrants | Cabo Verde | 0.0 /100 | #317 | Tragic 7.2% |
| Blacks/African Americans | 0.0 /100 | #318 | Tragic 7.2% |
| Guyanese | 0.0 /100 | #319 | Tragic 7.2% |
| Cape Verdeans | 0.0 /100 | #320 | Tragic 7.2% |
| Immigrants | Guyana | 0.0 /100 | #321 | Tragic 7.2% |
| Marshallese | 0.0 /100 | #322 | Tragic 7.2% |
| Immigrants | Yemen | 0.0 /100 | #323 | Tragic 7.3% |
| Immigrants | Dominica | 0.0 /100 | #324 | Tragic 7.3% |
| Apache | 0.0 /100 | #325 | Tragic 7.3% |
| Dominicans | 0.0 /100 | #326 | Tragic 7.7% |
| Immigrants | Dominican Republic | 0.0 /100 | #327 | Tragic 7.7% |
| Chippewa | 0.0 /100 | #328 | Tragic 7.8% |
| Cheyenne | 0.0 /100 | #329 | Tragic 7.8% |