Yuman vs Immigrants from Southern Europe Unemployment Among Ages 60 to 64 years
COMPARE
Yuman
Immigrants from Southern Europe
Unemployment Among Ages 60 to 64 years
Unemployment Among Ages 60 to 64 years Comparison
Yuman
Immigrants from Southern Europe
6.8%
UNEMPLOYMENT AMONG AGES 60 TO 64 YEARS
0.0/ 100
METRIC RATING
341st/ 347
METRIC RANK
4.8%
UNEMPLOYMENT AMONG AGES 60 TO 64 YEARS
56.7/ 100
METRIC RATING
168th/ 347
METRIC RANK
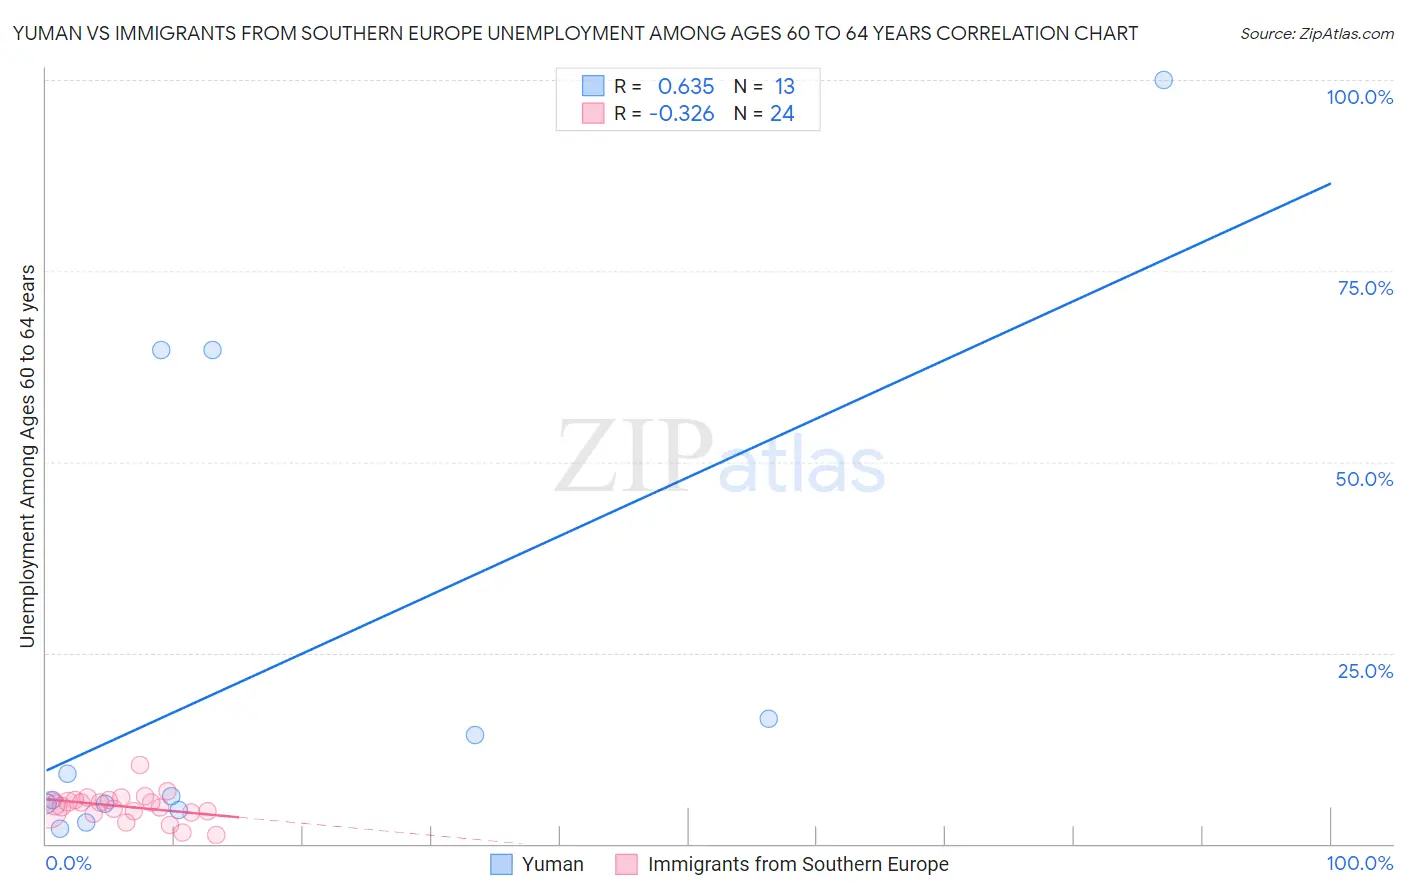
Yuman vs Immigrants from Southern Europe Unemployment Among Ages 60 to 64 years Correlation Chart
The statistical analysis conducted on geographies consisting of 39,921,658 people shows a significant positive correlation between the proportion of Yuman and unemployment rate among population between the ages 60 and 64 in the United States with a correlation coefficient (R) of 0.635 and weighted average of 6.8%. Similarly, the statistical analysis conducted on geographies consisting of 365,506,927 people shows a mild negative correlation between the proportion of Immigrants from Southern Europe and unemployment rate among population between the ages 60 and 64 in the United States with a correlation coefficient (R) of -0.326 and weighted average of 4.8%, a difference of 39.8%.
Unemployment Among Ages 60 to 64 years Correlation Summary
| Measurement | Yuman | Immigrants from Southern Europe |
| Minimum | 2.0% | 1.2% |
| Maximum | 100.0% | 10.3% |
| Range | 98.0% | 9.1% |
| Mean | 23.1% | 4.9% |
| Median | 6.2% | 5.0% |
| Interquartile 25% (IQ1) | 4.8% | 4.1% |
| Interquartile 75% (IQ3) | 40.5% | 5.7% |
| Interquartile Range (IQR) | 35.8% | 1.6% |
| Standard Deviation (Sample) | 31.8% | 1.8% |
| Standard Deviation (Population) | 30.5% | 1.8% |
Similar Demographics by Unemployment Among Ages 60 to 64 years
Demographics Similar to Yuman by Unemployment Among Ages 60 to 64 years
In terms of unemployment among ages 60 to 64 years, the demographic groups most similar to Yuman are Aleut (6.8%, a difference of 0.010%), Pueblo (6.7%, a difference of 0.53%), Immigrants from Yemen (6.8%, a difference of 0.73%), Tlingit-Haida (6.4%, a difference of 6.1%), and Arapaho (6.3%, a difference of 7.6%).
| Demographics | Rating | Rank | Unemployment Among Ages 60 to 64 years |
| Immigrants | Dominican Republic | 0.0 /100 | #333 | Tragic 6.0% |
| Puerto Ricans | 0.0 /100 | #334 | Tragic 6.1% |
| Vietnamese | 0.0 /100 | #335 | Tragic 6.1% |
| Kiowa | 0.0 /100 | #336 | Tragic 6.2% |
| Navajo | 0.0 /100 | #337 | Tragic 6.3% |
| Arapaho | 0.0 /100 | #338 | Tragic 6.3% |
| Tlingit-Haida | 0.0 /100 | #339 | Tragic 6.4% |
| Pueblo | 0.0 /100 | #340 | Tragic 6.7% |
| Yuman | 0.0 /100 | #341 | Tragic 6.8% |
| Aleuts | 0.0 /100 | #342 | Tragic 6.8% |
| Immigrants | Yemen | 0.0 /100 | #343 | Tragic 6.8% |
| Alaska Natives | 0.0 /100 | #344 | Tragic 7.6% |
| Alaskan Athabascans | 0.0 /100 | #345 | Tragic 8.4% |
| Inupiat | 0.0 /100 | #346 | Tragic 9.6% |
| Yup'ik | 0.0 /100 | #347 | Tragic 11.9% |
Demographics Similar to Immigrants from Southern Europe by Unemployment Among Ages 60 to 64 years
In terms of unemployment among ages 60 to 64 years, the demographic groups most similar to Immigrants from Southern Europe are Immigrants from France (4.8%, a difference of 0.040%), Immigrants from Northern Europe (4.8%, a difference of 0.090%), Immigrants from Korea (4.8%, a difference of 0.090%), Samoan (4.9%, a difference of 0.11%), and Palestinian (4.8%, a difference of 0.14%).
| Demographics | Rating | Rank | Unemployment Among Ages 60 to 64 years |
| Immigrants | Norway | 65.1 /100 | #161 | Good 4.8% |
| South Africans | 65.1 /100 | #162 | Good 4.8% |
| Immigrants | Belgium | 64.8 /100 | #163 | Good 4.8% |
| Pakistanis | 64.6 /100 | #164 | Good 4.8% |
| Immigrants | Panama | 62.0 /100 | #165 | Good 4.8% |
| Palestinians | 60.5 /100 | #166 | Good 4.8% |
| Immigrants | Northern Europe | 59.1 /100 | #167 | Average 4.8% |
| Immigrants | Southern Europe | 56.7 /100 | #168 | Average 4.8% |
| Immigrants | France | 55.5 /100 | #169 | Average 4.8% |
| Immigrants | Korea | 54.2 /100 | #170 | Average 4.8% |
| Samoans | 53.6 /100 | #171 | Average 4.9% |
| Immigrants | Turkey | 52.8 /100 | #172 | Average 4.9% |
| Immigrants | Hungary | 50.2 /100 | #173 | Average 4.9% |
| Immigrants | Western Europe | 50.0 /100 | #174 | Average 4.9% |
| Immigrants | Latvia | 46.9 /100 | #175 | Average 4.9% |