Navajo vs Immigrants from Dominican Republic Unemployment Among Ages 60 to 64 years
COMPARE
Navajo
Immigrants from Dominican Republic
Unemployment Among Ages 60 to 64 years
Unemployment Among Ages 60 to 64 years Comparison
Navajo
Immigrants from Dominican Republic
6.3%
UNEMPLOYMENT AMONG AGES 60 TO 64 YEARS
0.0/ 100
METRIC RATING
337th/ 347
METRIC RANK
6.0%
UNEMPLOYMENT AMONG AGES 60 TO 64 YEARS
0.0/ 100
METRIC RATING
333rd/ 347
METRIC RANK
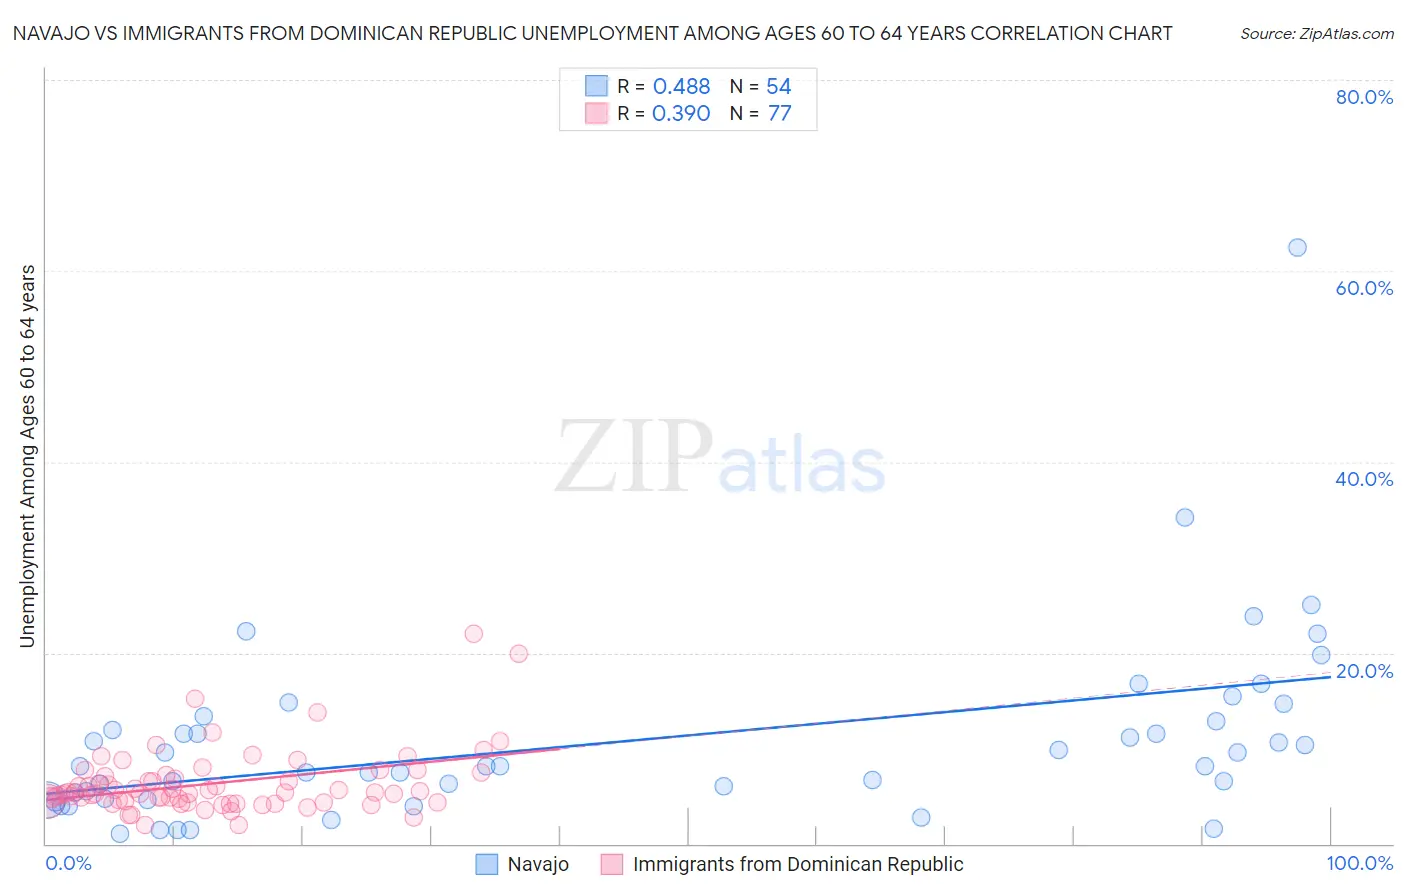
Navajo vs Immigrants from Dominican Republic Unemployment Among Ages 60 to 64 years Correlation Chart
The statistical analysis conducted on geographies consisting of 208,494,883 people shows a moderate positive correlation between the proportion of Navajo and unemployment rate among population between the ages 60 and 64 in the United States with a correlation coefficient (R) of 0.488 and weighted average of 6.3%. Similarly, the statistical analysis conducted on geographies consisting of 256,183,735 people shows a mild positive correlation between the proportion of Immigrants from Dominican Republic and unemployment rate among population between the ages 60 and 64 in the United States with a correlation coefficient (R) of 0.390 and weighted average of 6.0%, a difference of 4.5%.
Unemployment Among Ages 60 to 64 years Correlation Summary
| Measurement | Navajo | Immigrants from Dominican Republic |
| Minimum | 1.0% | 1.9% |
| Maximum | 62.5% | 22.0% |
| Range | 61.5% | 20.1% |
| Mean | 10.7% | 6.3% |
| Median | 8.1% | 5.3% |
| Interquartile 25% (IQ1) | 4.8% | 4.4% |
| Interquartile 75% (IQ3) | 12.8% | 7.1% |
| Interquartile Range (IQR) | 8.0% | 2.7% |
| Standard Deviation (Sample) | 9.9% | 3.4% |
| Standard Deviation (Population) | 9.8% | 3.4% |
Demographics Similar to Navajo and Immigrants from Dominican Republic by Unemployment Among Ages 60 to 64 years
In terms of unemployment among ages 60 to 64 years, the demographic groups most similar to Navajo are Arapaho (6.3%, a difference of 0.48%), Kiowa (6.2%, a difference of 1.1%), Tlingit-Haida (6.4%, a difference of 1.9%), Vietnamese (6.1%, a difference of 3.0%), and Puerto Rican (6.1%, a difference of 3.3%). Similarly, the demographic groups most similar to Immigrants from Dominican Republic are Dominican (6.0%, a difference of 0.35%), Yakama (6.0%, a difference of 0.37%), Immigrants from Armenia (6.0%, a difference of 0.51%), Immigrants from Bangladesh (6.0%, a difference of 0.77%), and Apache (6.0%, a difference of 0.78%).
| Demographics | Rating | Rank | Unemployment Among Ages 60 to 64 years |
| Paiute | 0.0 /100 | #325 | Tragic 5.8% |
| Immigrants | St. Vincent and the Grenadines | 0.0 /100 | #326 | Tragic 5.9% |
| Immigrants | Grenada | 0.0 /100 | #327 | Tragic 5.9% |
| Apache | 0.0 /100 | #328 | Tragic 6.0% |
| Immigrants | Bangladesh | 0.0 /100 | #329 | Tragic 6.0% |
| Immigrants | Armenia | 0.0 /100 | #330 | Tragic 6.0% |
| Yakama | 0.0 /100 | #331 | Tragic 6.0% |
| Dominicans | 0.0 /100 | #332 | Tragic 6.0% |
| Immigrants | Dominican Republic | 0.0 /100 | #333 | Tragic 6.0% |
| Puerto Ricans | 0.0 /100 | #334 | Tragic 6.1% |
| Vietnamese | 0.0 /100 | #335 | Tragic 6.1% |
| Kiowa | 0.0 /100 | #336 | Tragic 6.2% |
| Navajo | 0.0 /100 | #337 | Tragic 6.3% |
| Arapaho | 0.0 /100 | #338 | Tragic 6.3% |
| Tlingit-Haida | 0.0 /100 | #339 | Tragic 6.4% |
| Pueblo | 0.0 /100 | #340 | Tragic 6.7% |
| Yuman | 0.0 /100 | #341 | Tragic 6.8% |
| Aleuts | 0.0 /100 | #342 | Tragic 6.8% |
| Immigrants | Yemen | 0.0 /100 | #343 | Tragic 6.8% |
| Alaska Natives | 0.0 /100 | #344 | Tragic 7.6% |
| Alaskan Athabascans | 0.0 /100 | #345 | Tragic 8.4% |