Yuman vs Immigrants from Lithuania Unemployment Among Ages 60 to 64 years
COMPARE
Yuman
Immigrants from Lithuania
Unemployment Among Ages 60 to 64 years
Unemployment Among Ages 60 to 64 years Comparison
Yuman
Immigrants from Lithuania
6.8%
UNEMPLOYMENT AMONG AGES 60 TO 64 YEARS
0.0/ 100
METRIC RATING
341st/ 347
METRIC RANK
4.8%
UNEMPLOYMENT AMONG AGES 60 TO 64 YEARS
86.7/ 100
METRIC RATING
138th/ 347
METRIC RANK
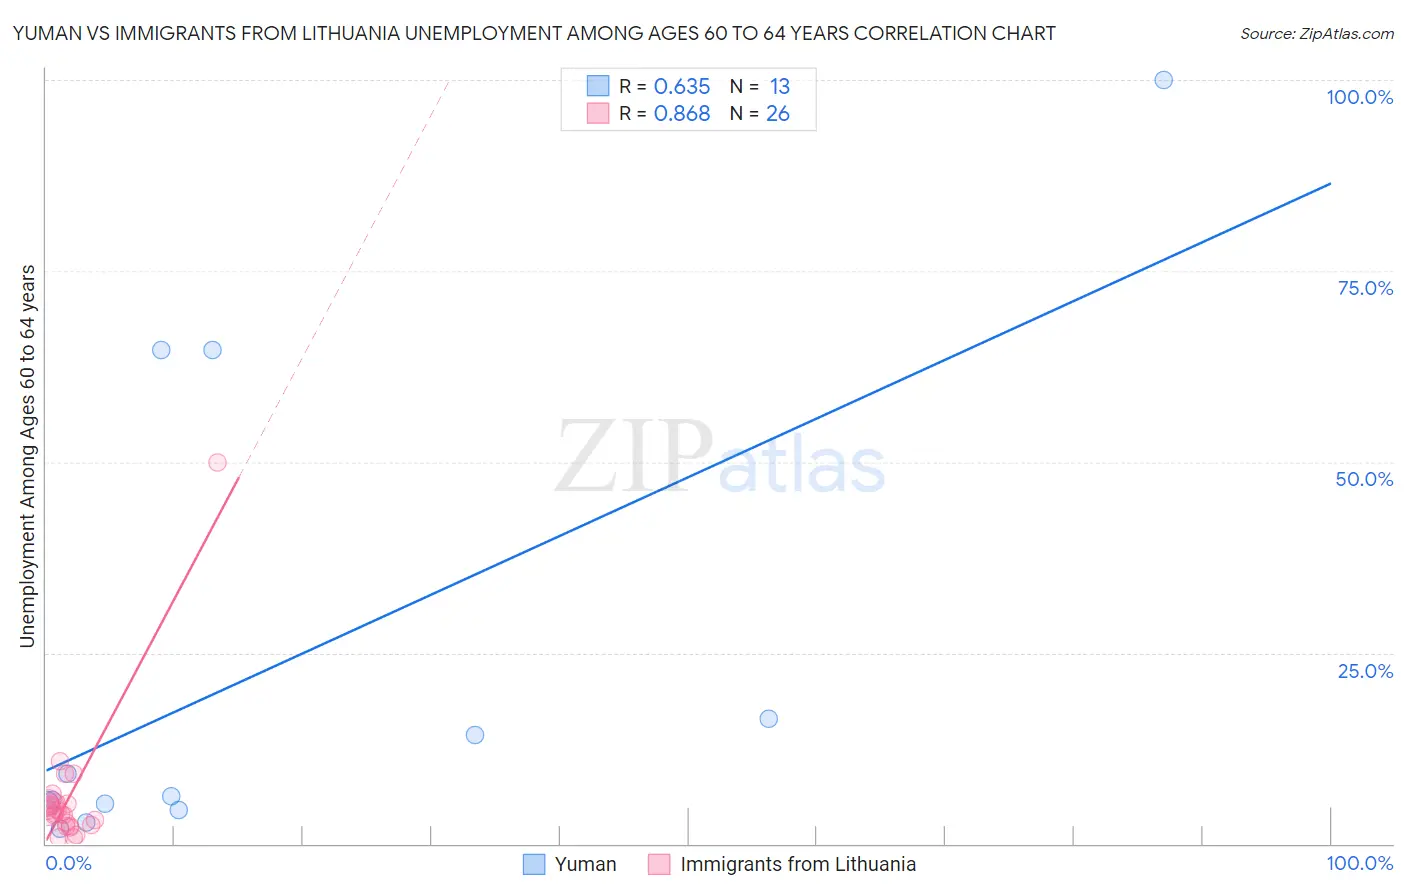
Yuman vs Immigrants from Lithuania Unemployment Among Ages 60 to 64 years Correlation Chart
The statistical analysis conducted on geographies consisting of 39,921,658 people shows a significant positive correlation between the proportion of Yuman and unemployment rate among population between the ages 60 and 64 in the United States with a correlation coefficient (R) of 0.635 and weighted average of 6.8%. Similarly, the statistical analysis conducted on geographies consisting of 114,105,176 people shows a very strong positive correlation between the proportion of Immigrants from Lithuania and unemployment rate among population between the ages 60 and 64 in the United States with a correlation coefficient (R) of 0.868 and weighted average of 4.8%, a difference of 41.8%.
Unemployment Among Ages 60 to 64 years Correlation Summary
| Measurement | Yuman | Immigrants from Lithuania |
| Minimum | 2.0% | 0.80% |
| Maximum | 100.0% | 50.0% |
| Range | 98.0% | 49.2% |
| Mean | 23.1% | 6.1% |
| Median | 6.2% | 4.1% |
| Interquartile 25% (IQ1) | 4.8% | 2.4% |
| Interquartile 75% (IQ3) | 40.5% | 5.3% |
| Interquartile Range (IQR) | 35.8% | 2.9% |
| Standard Deviation (Sample) | 31.8% | 9.3% |
| Standard Deviation (Population) | 30.5% | 9.1% |
Similar Demographics by Unemployment Among Ages 60 to 64 years
Demographics Similar to Yuman by Unemployment Among Ages 60 to 64 years
In terms of unemployment among ages 60 to 64 years, the demographic groups most similar to Yuman are Aleut (6.8%, a difference of 0.010%), Pueblo (6.7%, a difference of 0.53%), Immigrants from Yemen (6.8%, a difference of 0.73%), Tlingit-Haida (6.4%, a difference of 6.1%), and Arapaho (6.3%, a difference of 7.6%).
| Demographics | Rating | Rank | Unemployment Among Ages 60 to 64 years |
| Immigrants | Dominican Republic | 0.0 /100 | #333 | Tragic 6.0% |
| Puerto Ricans | 0.0 /100 | #334 | Tragic 6.1% |
| Vietnamese | 0.0 /100 | #335 | Tragic 6.1% |
| Kiowa | 0.0 /100 | #336 | Tragic 6.2% |
| Navajo | 0.0 /100 | #337 | Tragic 6.3% |
| Arapaho | 0.0 /100 | #338 | Tragic 6.3% |
| Tlingit-Haida | 0.0 /100 | #339 | Tragic 6.4% |
| Pueblo | 0.0 /100 | #340 | Tragic 6.7% |
| Yuman | 0.0 /100 | #341 | Tragic 6.8% |
| Aleuts | 0.0 /100 | #342 | Tragic 6.8% |
| Immigrants | Yemen | 0.0 /100 | #343 | Tragic 6.8% |
| Alaska Natives | 0.0 /100 | #344 | Tragic 7.6% |
| Alaskan Athabascans | 0.0 /100 | #345 | Tragic 8.4% |
| Inupiat | 0.0 /100 | #346 | Tragic 9.6% |
| Yup'ik | 0.0 /100 | #347 | Tragic 11.9% |
Demographics Similar to Immigrants from Lithuania by Unemployment Among Ages 60 to 64 years
In terms of unemployment among ages 60 to 64 years, the demographic groups most similar to Immigrants from Lithuania are Immigrants from Africa (4.8%, a difference of 0.0%), Cambodian (4.8%, a difference of 0.020%), Pima (4.8%, a difference of 0.070%), French Canadian (4.8%, a difference of 0.080%), and Pennsylvania German (4.8%, a difference of 0.090%).
| Demographics | Rating | Rank | Unemployment Among Ages 60 to 64 years |
| Immigrants | Lebanon | 89.6 /100 | #131 | Excellent 4.8% |
| Lithuanians | 89.6 /100 | #132 | Excellent 4.8% |
| Yaqui | 89.5 /100 | #133 | Excellent 4.8% |
| Basques | 88.8 /100 | #134 | Excellent 4.8% |
| Pennsylvania Germans | 87.8 /100 | #135 | Excellent 4.8% |
| French Canadians | 87.6 /100 | #136 | Excellent 4.8% |
| Cambodians | 86.9 /100 | #137 | Excellent 4.8% |
| Immigrants | Lithuania | 86.7 /100 | #138 | Excellent 4.8% |
| Immigrants | Africa | 86.6 /100 | #139 | Excellent 4.8% |
| Pima | 85.8 /100 | #140 | Excellent 4.8% |
| Panamanians | 85.5 /100 | #141 | Excellent 4.8% |
| Immigrants | Ethiopia | 85.3 /100 | #142 | Excellent 4.8% |
| Italians | 85.0 /100 | #143 | Excellent 4.8% |
| Immigrants | Pakistan | 83.3 /100 | #144 | Excellent 4.8% |
| Burmese | 83.1 /100 | #145 | Excellent 4.8% |