Immigrants from Peru vs Immigrants from Dominican Republic Unemployment Among Ages 60 to 64 years
COMPARE
Immigrants from Peru
Immigrants from Dominican Republic
Unemployment Among Ages 60 to 64 years
Unemployment Among Ages 60 to 64 years Comparison
Immigrants from Peru
Immigrants from Dominican Republic
5.1%
UNEMPLOYMENT AMONG AGES 60 TO 64 YEARS
0.7/ 100
METRIC RATING
256th/ 347
METRIC RANK
6.0%
UNEMPLOYMENT AMONG AGES 60 TO 64 YEARS
0.0/ 100
METRIC RATING
333rd/ 347
METRIC RANK
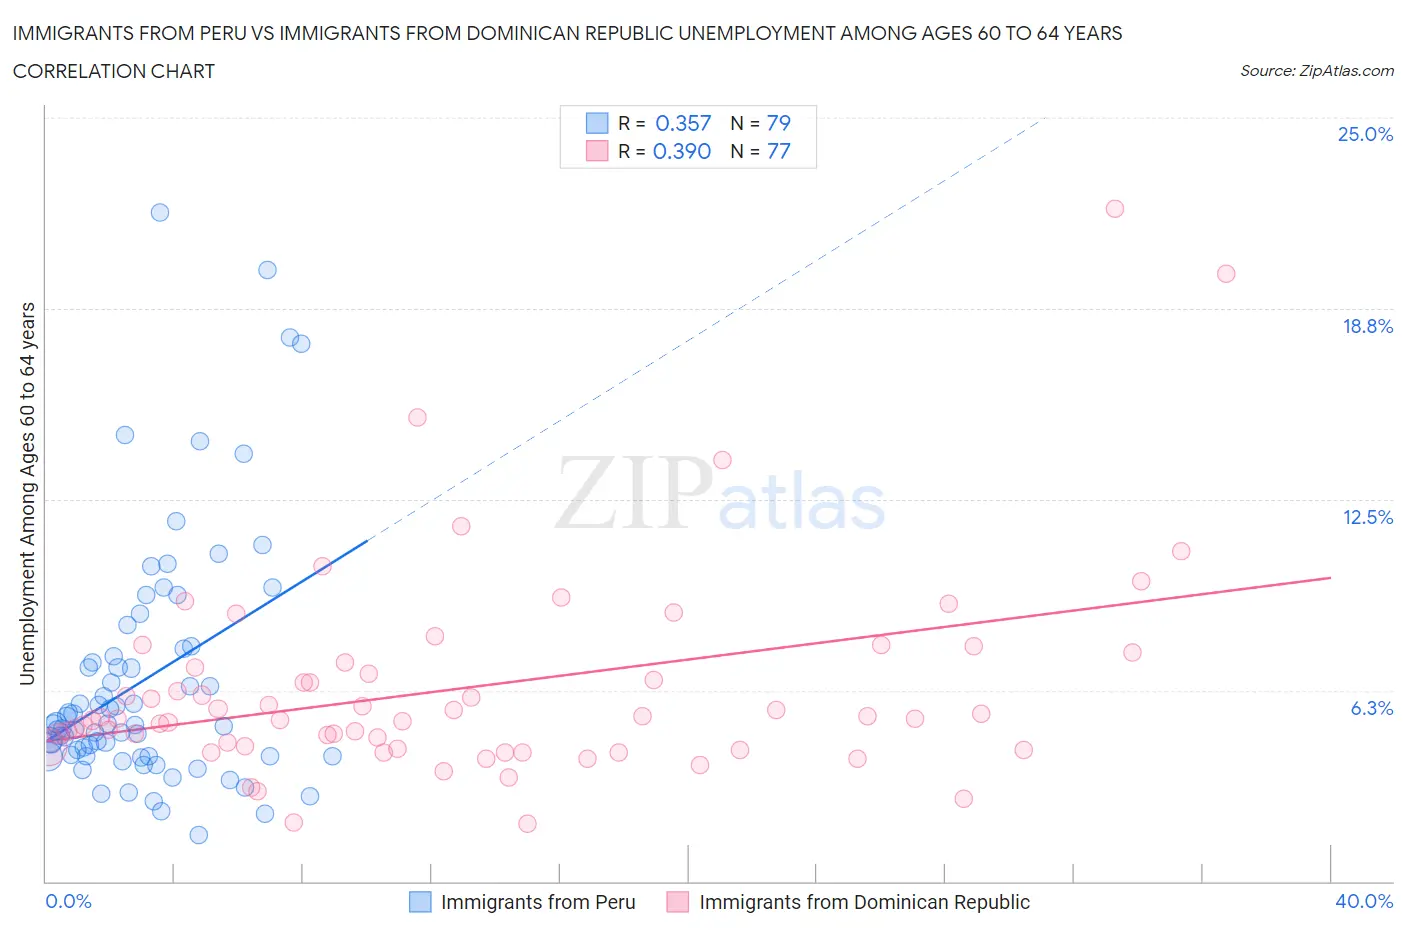
Immigrants from Peru vs Immigrants from Dominican Republic Unemployment Among Ages 60 to 64 years Correlation Chart
The statistical analysis conducted on geographies consisting of 306,267,626 people shows a mild positive correlation between the proportion of Immigrants from Peru and unemployment rate among population between the ages 60 and 64 in the United States with a correlation coefficient (R) of 0.357 and weighted average of 5.1%. Similarly, the statistical analysis conducted on geographies consisting of 256,183,735 people shows a mild positive correlation between the proportion of Immigrants from Dominican Republic and unemployment rate among population between the ages 60 and 64 in the United States with a correlation coefficient (R) of 0.390 and weighted average of 6.0%, a difference of 18.3%.
Unemployment Among Ages 60 to 64 years Correlation Summary
| Measurement | Immigrants from Peru | Immigrants from Dominican Republic |
| Minimum | 1.5% | 1.9% |
| Maximum | 21.9% | 22.0% |
| Range | 20.4% | 20.1% |
| Mean | 6.6% | 6.3% |
| Median | 5.1% | 5.3% |
| Interquartile 25% (IQ1) | 4.1% | 4.4% |
| Interquartile 75% (IQ3) | 7.6% | 7.1% |
| Interquartile Range (IQR) | 3.5% | 2.7% |
| Standard Deviation (Sample) | 4.1% | 3.4% |
| Standard Deviation (Population) | 4.0% | 3.4% |
Similar Demographics by Unemployment Among Ages 60 to 64 years
Demographics Similar to Immigrants from Peru by Unemployment Among Ages 60 to 64 years
In terms of unemployment among ages 60 to 64 years, the demographic groups most similar to Immigrants from Peru are Japanese (5.1%, a difference of 0.11%), Estonian (5.1%, a difference of 0.12%), Costa Rican (5.1%, a difference of 0.14%), Immigrants from China (5.1%, a difference of 0.17%), and Immigrants from Switzerland (5.1%, a difference of 0.20%).
| Demographics | Rating | Rank | Unemployment Among Ages 60 to 64 years |
| South Americans | 1.0 /100 | #249 | Tragic 5.1% |
| Immigrants | Cambodia | 0.9 /100 | #250 | Tragic 5.1% |
| Immigrants | Uruguay | 0.9 /100 | #251 | Tragic 5.1% |
| Immigrants | Switzerland | 0.9 /100 | #252 | Tragic 5.1% |
| Immigrants | China | 0.9 /100 | #253 | Tragic 5.1% |
| Costa Ricans | 0.8 /100 | #254 | Tragic 5.1% |
| Estonians | 0.8 /100 | #255 | Tragic 5.1% |
| Immigrants | Peru | 0.7 /100 | #256 | Tragic 5.1% |
| Japanese | 0.6 /100 | #257 | Tragic 5.1% |
| Celtics | 0.5 /100 | #258 | Tragic 5.1% |
| Hondurans | 0.5 /100 | #259 | Tragic 5.1% |
| Immigrants | Honduras | 0.4 /100 | #260 | Tragic 5.1% |
| Immigrants | Ghana | 0.4 /100 | #261 | Tragic 5.1% |
| Immigrants | Uzbekistan | 0.4 /100 | #262 | Tragic 5.1% |
| Immigrants | Immigrants | 0.4 /100 | #263 | Tragic 5.1% |
Demographics Similar to Immigrants from Dominican Republic by Unemployment Among Ages 60 to 64 years
In terms of unemployment among ages 60 to 64 years, the demographic groups most similar to Immigrants from Dominican Republic are Dominican (6.0%, a difference of 0.35%), Yakama (6.0%, a difference of 0.37%), Immigrants from Armenia (6.0%, a difference of 0.51%), Immigrants from Bangladesh (6.0%, a difference of 0.77%), and Apache (6.0%, a difference of 0.78%).
| Demographics | Rating | Rank | Unemployment Among Ages 60 to 64 years |
| Immigrants | St. Vincent and the Grenadines | 0.0 /100 | #326 | Tragic 5.9% |
| Immigrants | Grenada | 0.0 /100 | #327 | Tragic 5.9% |
| Apache | 0.0 /100 | #328 | Tragic 6.0% |
| Immigrants | Bangladesh | 0.0 /100 | #329 | Tragic 6.0% |
| Immigrants | Armenia | 0.0 /100 | #330 | Tragic 6.0% |
| Yakama | 0.0 /100 | #331 | Tragic 6.0% |
| Dominicans | 0.0 /100 | #332 | Tragic 6.0% |
| Immigrants | Dominican Republic | 0.0 /100 | #333 | Tragic 6.0% |
| Puerto Ricans | 0.0 /100 | #334 | Tragic 6.1% |
| Vietnamese | 0.0 /100 | #335 | Tragic 6.1% |
| Kiowa | 0.0 /100 | #336 | Tragic 6.2% |
| Navajo | 0.0 /100 | #337 | Tragic 6.3% |
| Arapaho | 0.0 /100 | #338 | Tragic 6.3% |
| Tlingit-Haida | 0.0 /100 | #339 | Tragic 6.4% |
| Pueblo | 0.0 /100 | #340 | Tragic 6.7% |