Sudanese vs Immigrants from Albania Unemployment
COMPARE
Sudanese
Immigrants from Albania
Unemployment
Unemployment Comparison
Sudanese
Immigrants from Albania
4.8%
UNEMPLOYMENT
99.8/ 100
METRIC RATING
33rd/ 347
METRIC RANK
5.4%
UNEMPLOYMENT
13.5/ 100
METRIC RATING
217th/ 347
METRIC RANK
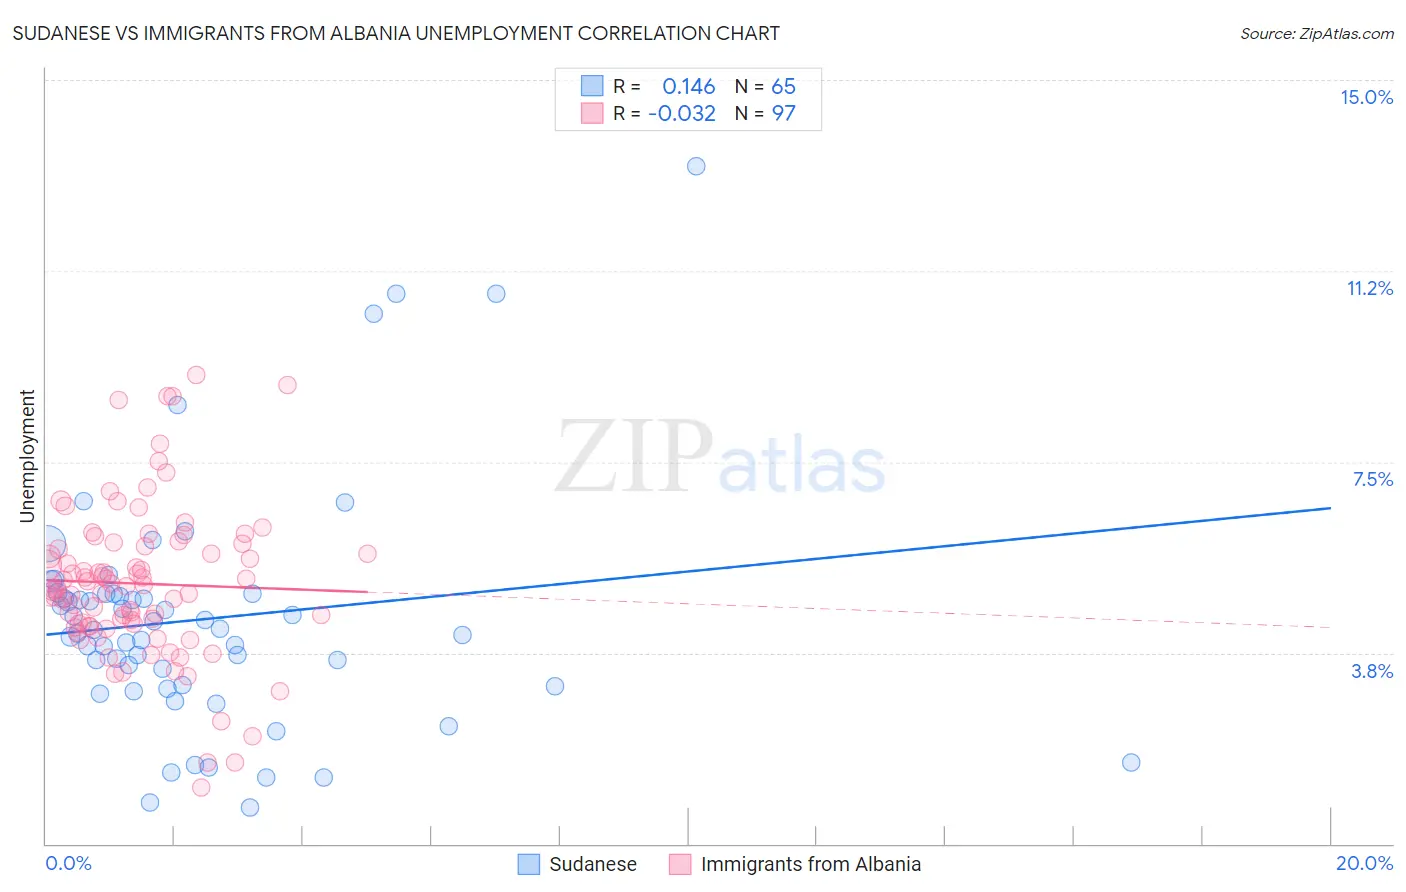
Sudanese vs Immigrants from Albania Unemployment Correlation Chart
The statistical analysis conducted on geographies consisting of 110,101,890 people shows a poor positive correlation between the proportion of Sudanese and unemployment in the United States with a correlation coefficient (R) of 0.146 and weighted average of 4.8%. Similarly, the statistical analysis conducted on geographies consisting of 119,392,247 people shows no correlation between the proportion of Immigrants from Albania and unemployment in the United States with a correlation coefficient (R) of -0.032 and weighted average of 5.4%, a difference of 13.6%.
Unemployment Correlation Summary
| Measurement | Sudanese | Immigrants from Albania |
| Minimum | 0.70% | 1.1% |
| Maximum | 13.3% | 9.2% |
| Range | 12.6% | 8.1% |
| Mean | 4.4% | 5.1% |
| Median | 4.2% | 5.0% |
| Interquartile 25% (IQ1) | 3.1% | 4.3% |
| Interquartile 75% (IQ3) | 4.9% | 5.9% |
| Interquartile Range (IQR) | 1.8% | 1.6% |
| Standard Deviation (Sample) | 2.3% | 1.5% |
| Standard Deviation (Population) | 2.3% | 1.5% |
Similar Demographics by Unemployment
Demographics Similar to Sudanese by Unemployment
In terms of unemployment, the demographic groups most similar to Sudanese are Zimbabwean (4.8%, a difference of 0.010%), Immigrants from Bolivia (4.8%, a difference of 0.040%), Croatian (4.8%, a difference of 0.11%), Scotch-Irish (4.8%, a difference of 0.11%), and Irish (4.8%, a difference of 0.13%).
| Demographics | Rating | Rank | Unemployment |
| Bulgarians | 99.9 /100 | #26 | Exceptional 4.7% |
| Finns | 99.9 /100 | #27 | Exceptional 4.7% |
| Cubans | 99.8 /100 | #28 | Exceptional 4.7% |
| Poles | 99.8 /100 | #29 | Exceptional 4.7% |
| Irish | 99.8 /100 | #30 | Exceptional 4.8% |
| Croatians | 99.8 /100 | #31 | Exceptional 4.8% |
| Zimbabweans | 99.8 /100 | #32 | Exceptional 4.8% |
| Sudanese | 99.8 /100 | #33 | Exceptional 4.8% |
| Immigrants | Bolivia | 99.8 /100 | #34 | Exceptional 4.8% |
| Scotch-Irish | 99.8 /100 | #35 | Exceptional 4.8% |
| Tongans | 99.7 /100 | #36 | Exceptional 4.8% |
| Czechoslovakians | 99.7 /100 | #37 | Exceptional 4.8% |
| Bolivians | 99.7 /100 | #38 | Exceptional 4.8% |
| Lithuanians | 99.7 /100 | #39 | Exceptional 4.8% |
| Northern Europeans | 99.7 /100 | #40 | Exceptional 4.8% |
Demographics Similar to Immigrants from Albania by Unemployment
In terms of unemployment, the demographic groups most similar to Immigrants from Albania are Immigrants from South America (5.4%, a difference of 0.0%), Choctaw (5.4%, a difference of 0.10%), Delaware (5.4%, a difference of 0.16%), Immigrants from Middle Africa (5.4%, a difference of 0.22%), and Immigrants from Costa Rica (5.4%, a difference of 0.22%).
| Demographics | Rating | Rank | Unemployment |
| Immigrants | Iraq | 18.6 /100 | #210 | Poor 5.4% |
| Iraqis | 18.1 /100 | #211 | Poor 5.4% |
| Ugandans | 18.0 /100 | #212 | Poor 5.4% |
| Immigrants | Middle Africa | 15.3 /100 | #213 | Poor 5.4% |
| Immigrants | Costa Rica | 15.2 /100 | #214 | Poor 5.4% |
| Delaware | 14.7 /100 | #215 | Poor 5.4% |
| Immigrants | South America | 13.5 /100 | #216 | Poor 5.4% |
| Immigrants | Albania | 13.5 /100 | #217 | Poor 5.4% |
| Choctaw | 12.7 /100 | #218 | Poor 5.4% |
| Bangladeshis | 11.2 /100 | #219 | Poor 5.4% |
| Soviet Union | 10.6 /100 | #220 | Poor 5.4% |
| Immigrants | Philippines | 10.4 /100 | #221 | Poor 5.4% |
| Iroquois | 10.3 /100 | #222 | Poor 5.4% |
| Seminole | 9.2 /100 | #223 | Tragic 5.4% |
| Israelis | 8.8 /100 | #224 | Tragic 5.4% |