Colville vs Immigrants from Albania Unemployment
COMPARE
Colville
Immigrants from Albania
Unemployment
Unemployment Comparison
Colville
Immigrants from Albania
6.6%
UNEMPLOYMENT
0.0/ 100
METRIC RATING
312th/ 347
METRIC RANK
5.4%
UNEMPLOYMENT
13.5/ 100
METRIC RATING
217th/ 347
METRIC RANK
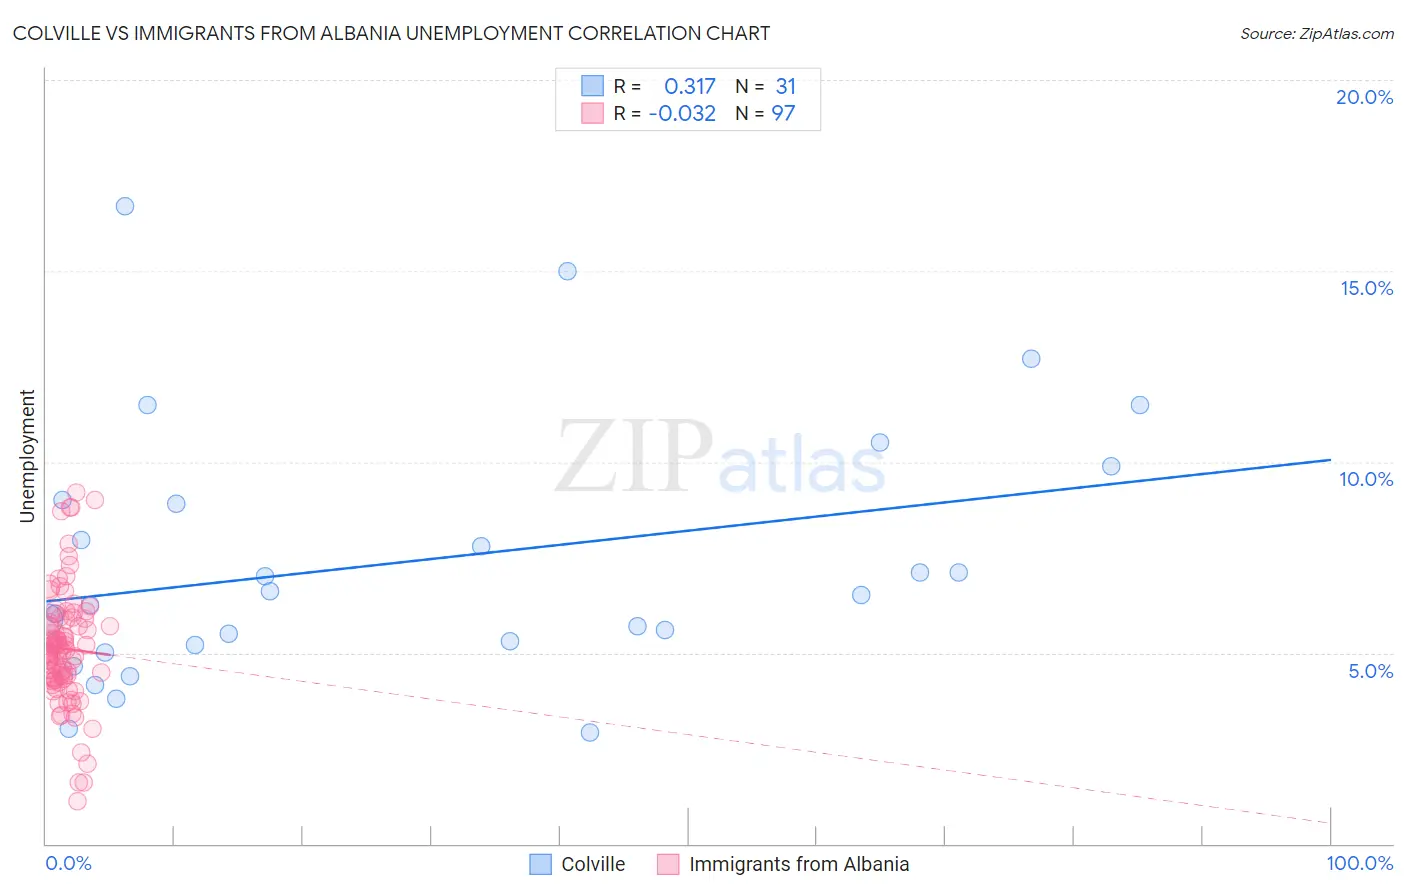
Colville vs Immigrants from Albania Unemployment Correlation Chart
The statistical analysis conducted on geographies consisting of 34,675,469 people shows a mild positive correlation between the proportion of Colville and unemployment in the United States with a correlation coefficient (R) of 0.317 and weighted average of 6.6%. Similarly, the statistical analysis conducted on geographies consisting of 119,392,247 people shows no correlation between the proportion of Immigrants from Albania and unemployment in the United States with a correlation coefficient (R) of -0.032 and weighted average of 5.4%, a difference of 21.5%.
Unemployment Correlation Summary
| Measurement | Colville | Immigrants from Albania |
| Minimum | 2.9% | 1.1% |
| Maximum | 16.7% | 9.2% |
| Range | 13.8% | 8.1% |
| Mean | 7.4% | 5.1% |
| Median | 6.5% | 5.0% |
| Interquartile 25% (IQ1) | 5.2% | 4.3% |
| Interquartile 75% (IQ3) | 9.0% | 5.9% |
| Interquartile Range (IQR) | 3.8% | 1.6% |
| Standard Deviation (Sample) | 3.4% | 1.5% |
| Standard Deviation (Population) | 3.3% | 1.5% |
Similar Demographics by Unemployment
Demographics Similar to Colville by Unemployment
In terms of unemployment, the demographic groups most similar to Colville are Immigrants from Barbados (6.6%, a difference of 0.38%), Cape Verdean (6.5%, a difference of 0.57%), Immigrants from Belize (6.5%, a difference of 0.91%), Black/African American (6.6%, a difference of 0.93%), and Vietnamese (6.5%, a difference of 1.2%).
| Demographics | Rating | Rank | Unemployment |
| Menominee | 0.0 /100 | #305 | Tragic 6.4% |
| Lumbee | 0.0 /100 | #306 | Tragic 6.4% |
| Immigrants | Bangladesh | 0.0 /100 | #307 | Tragic 6.5% |
| Barbadians | 0.0 /100 | #308 | Tragic 6.5% |
| Vietnamese | 0.0 /100 | #309 | Tragic 6.5% |
| Immigrants | Belize | 0.0 /100 | #310 | Tragic 6.5% |
| Cape Verdeans | 0.0 /100 | #311 | Tragic 6.5% |
| Colville | 0.0 /100 | #312 | Tragic 6.6% |
| Immigrants | Barbados | 0.0 /100 | #313 | Tragic 6.6% |
| Blacks/African Americans | 0.0 /100 | #314 | Tragic 6.6% |
| Houma | 0.0 /100 | #315 | Tragic 6.7% |
| Immigrants | Dominica | 0.0 /100 | #316 | Tragic 6.7% |
| Shoshone | 0.0 /100 | #317 | Tragic 6.8% |
| Immigrants | Cabo Verde | 0.0 /100 | #318 | Tragic 6.8% |
| British West Indians | 0.0 /100 | #319 | Tragic 6.8% |
Demographics Similar to Immigrants from Albania by Unemployment
In terms of unemployment, the demographic groups most similar to Immigrants from Albania are Immigrants from South America (5.4%, a difference of 0.0%), Choctaw (5.4%, a difference of 0.10%), Delaware (5.4%, a difference of 0.16%), Immigrants from Middle Africa (5.4%, a difference of 0.22%), and Immigrants from Costa Rica (5.4%, a difference of 0.22%).
| Demographics | Rating | Rank | Unemployment |
| Immigrants | Iraq | 18.6 /100 | #210 | Poor 5.4% |
| Iraqis | 18.1 /100 | #211 | Poor 5.4% |
| Ugandans | 18.0 /100 | #212 | Poor 5.4% |
| Immigrants | Middle Africa | 15.3 /100 | #213 | Poor 5.4% |
| Immigrants | Costa Rica | 15.2 /100 | #214 | Poor 5.4% |
| Delaware | 14.7 /100 | #215 | Poor 5.4% |
| Immigrants | South America | 13.5 /100 | #216 | Poor 5.4% |
| Immigrants | Albania | 13.5 /100 | #217 | Poor 5.4% |
| Choctaw | 12.7 /100 | #218 | Poor 5.4% |
| Bangladeshis | 11.2 /100 | #219 | Poor 5.4% |
| Soviet Union | 10.6 /100 | #220 | Poor 5.4% |
| Immigrants | Philippines | 10.4 /100 | #221 | Poor 5.4% |
| Iroquois | 10.3 /100 | #222 | Poor 5.4% |
| Seminole | 9.2 /100 | #223 | Tragic 5.4% |
| Israelis | 8.8 /100 | #224 | Tragic 5.4% |