Yaqui vs Immigrants from Western Africa Unemployment Among Women with Children Ages 6 to 17 years
COMPARE
Yaqui
Immigrants from Western Africa
Unemployment Among Women with Children Ages 6 to 17 years
Unemployment Among Women with Children Ages 6 to 17 years Comparison
Yaqui
Immigrants from Western Africa
8.7%
UNEMPLOYMENT AMONG WOMEN WITH CHILDREN AGES 6 TO 17 YEARS
92.2/ 100
METRIC RATING
132nd/ 347
METRIC RANK
10.1%
UNEMPLOYMENT AMONG WOMEN WITH CHILDREN AGES 6 TO 17 YEARS
0.0/ 100
METRIC RATING
296th/ 347
METRIC RANK
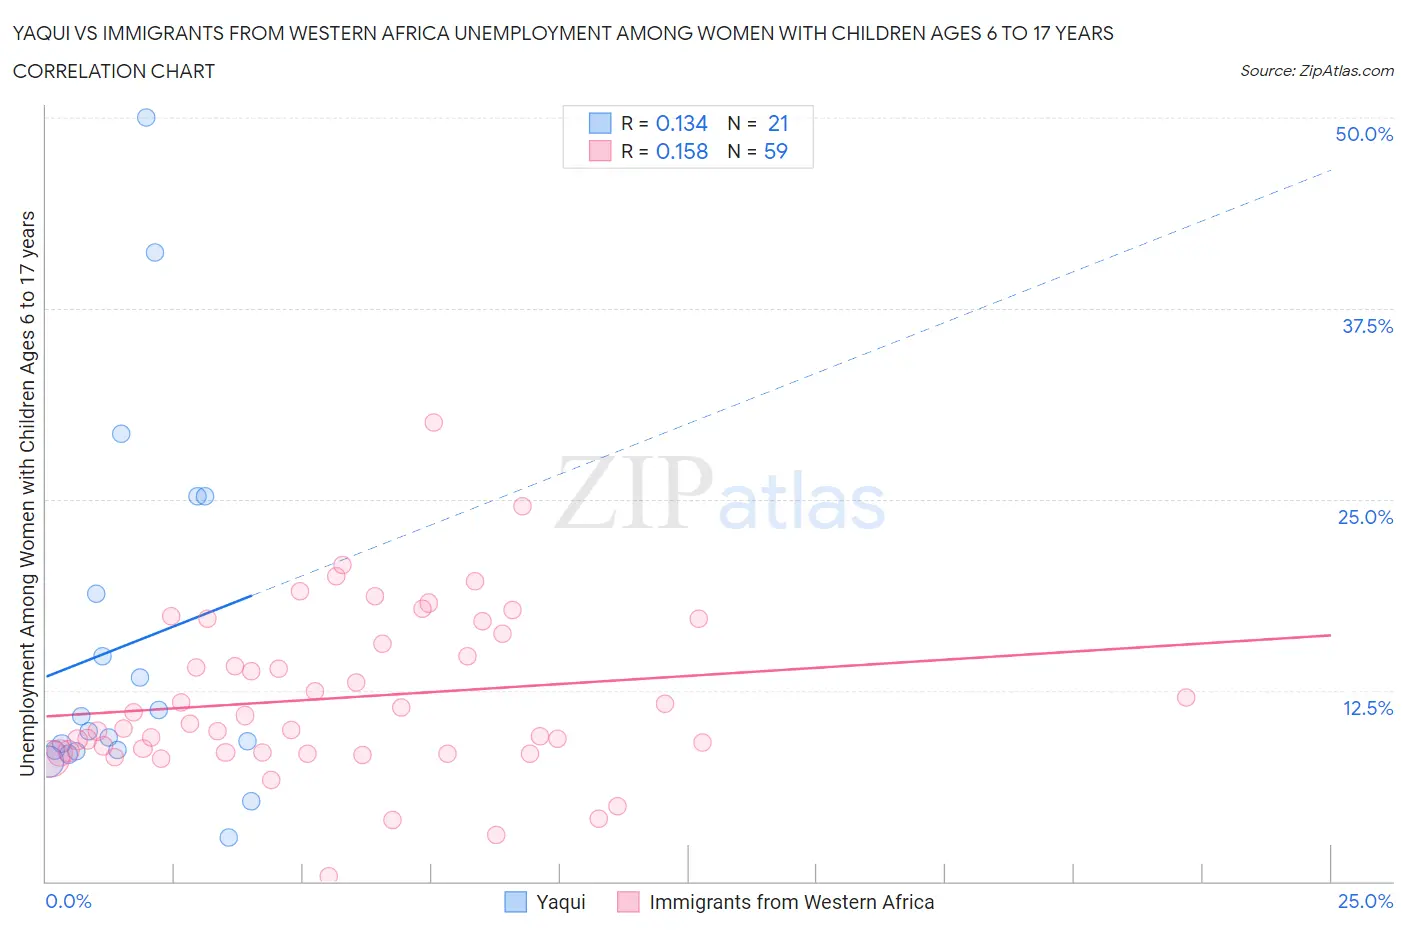
Yaqui vs Immigrants from Western Africa Unemployment Among Women with Children Ages 6 to 17 years Correlation Chart
The statistical analysis conducted on geographies consisting of 95,121,175 people shows a poor positive correlation between the proportion of Yaqui and unemployment rate among women with children between the ages 6 and 17 in the United States with a correlation coefficient (R) of 0.134 and weighted average of 8.7%. Similarly, the statistical analysis conducted on geographies consisting of 270,073,624 people shows a poor positive correlation between the proportion of Immigrants from Western Africa and unemployment rate among women with children between the ages 6 and 17 in the United States with a correlation coefficient (R) of 0.158 and weighted average of 10.1%, a difference of 15.4%.
Unemployment Among Women with Children Ages 6 to 17 years Correlation Summary
| Measurement | Yaqui | Immigrants from Western Africa |
| Minimum | 2.9% | 0.30% |
| Maximum | 50.0% | 30.0% |
| Range | 47.1% | 29.7% |
| Mean | 15.6% | 12.0% |
| Median | 9.8% | 10.3% |
| Interquartile 25% (IQ1) | 8.5% | 8.5% |
| Interquartile 75% (IQ3) | 22.0% | 16.2% |
| Interquartile Range (IQR) | 13.5% | 7.7% |
| Standard Deviation (Sample) | 12.2% | 5.4% |
| Standard Deviation (Population) | 11.9% | 5.4% |
Similar Demographics by Unemployment Among Women with Children Ages 6 to 17 years
Demographics Similar to Yaqui by Unemployment Among Women with Children Ages 6 to 17 years
In terms of unemployment among women with children ages 6 to 17 years, the demographic groups most similar to Yaqui are Slavic (8.7%, a difference of 0.010%), Egyptian (8.7%, a difference of 0.060%), Immigrants from Western Asia (8.7%, a difference of 0.16%), Immigrants from Ireland (8.7%, a difference of 0.17%), and European (8.7%, a difference of 0.23%).
| Demographics | Rating | Rank | Unemployment Among Women with Children Ages 6 to 17 years |
| South Africans | 94.6 /100 | #125 | Exceptional 8.7% |
| Immigrants | Northern Africa | 94.4 /100 | #126 | Exceptional 8.7% |
| Czechs | 94.4 /100 | #127 | Exceptional 8.7% |
| Hmong | 94.3 /100 | #128 | Exceptional 8.7% |
| Barbadians | 93.8 /100 | #129 | Exceptional 8.7% |
| Immigrants | Western Asia | 93.1 /100 | #130 | Exceptional 8.7% |
| Slavs | 92.2 /100 | #131 | Exceptional 8.7% |
| Yaqui | 92.2 /100 | #132 | Exceptional 8.7% |
| Egyptians | 91.8 /100 | #133 | Exceptional 8.7% |
| Immigrants | Ireland | 91.0 /100 | #134 | Exceptional 8.7% |
| Europeans | 90.6 /100 | #135 | Exceptional 8.7% |
| Immigrants | Latvia | 90.4 /100 | #136 | Exceptional 8.7% |
| Immigrants | Argentina | 90.0 /100 | #137 | Excellent 8.7% |
| Immigrants | Ethiopia | 89.5 /100 | #138 | Excellent 8.8% |
| Northern Europeans | 89.2 /100 | #139 | Excellent 8.8% |
Demographics Similar to Immigrants from Western Africa by Unemployment Among Women with Children Ages 6 to 17 years
In terms of unemployment among women with children ages 6 to 17 years, the demographic groups most similar to Immigrants from Western Africa are Immigrants from Caribbean (10.1%, a difference of 0.020%), Immigrants from Haiti (10.1%, a difference of 0.32%), Cherokee (10.0%, a difference of 0.34%), Immigrants from Honduras (10.1%, a difference of 0.34%), and Nigerian (10.1%, a difference of 0.36%).
| Demographics | Rating | Rank | Unemployment Among Women with Children Ages 6 to 17 years |
| Hondurans | 0.0 /100 | #289 | Tragic 10.0% |
| Sub-Saharan Africans | 0.0 /100 | #290 | Tragic 10.0% |
| Immigrants | Nonimmigrants | 0.0 /100 | #291 | Tragic 10.0% |
| Carpatho Rusyns | 0.0 /100 | #292 | Tragic 10.0% |
| Haitians | 0.0 /100 | #293 | Tragic 10.0% |
| Ecuadorians | 0.0 /100 | #294 | Tragic 10.0% |
| Cherokee | 0.0 /100 | #295 | Tragic 10.0% |
| Immigrants | Western Africa | 0.0 /100 | #296 | Tragic 10.1% |
| Immigrants | Caribbean | 0.0 /100 | #297 | Tragic 10.1% |
| Immigrants | Haiti | 0.0 /100 | #298 | Tragic 10.1% |
| Immigrants | Honduras | 0.0 /100 | #299 | Tragic 10.1% |
| Nigerians | 0.0 /100 | #300 | Tragic 10.1% |
| Immigrants | Bahamas | 0.0 /100 | #301 | Tragic 10.1% |
| Venezuelans | 0.0 /100 | #302 | Tragic 10.2% |
| Immigrants | Ecuador | 0.0 /100 | #303 | Tragic 10.2% |