Yakama vs Immigrants from Ecuador Unemployment Among Ages 20 to 24 years
COMPARE
Yakama
Immigrants from Ecuador
Unemployment Among Ages 20 to 24 years
Unemployment Among Ages 20 to 24 years Comparison
Yakama
Immigrants from Ecuador
13.1%
UNEMPLOYMENT AMONG AGES 20 TO 24 YEARS
0.0/ 100
METRIC RATING
323rd/ 347
METRIC RANK
11.8%
UNEMPLOYMENT AMONG AGES 20 TO 24 YEARS
0.0/ 100
METRIC RATING
287th/ 347
METRIC RANK
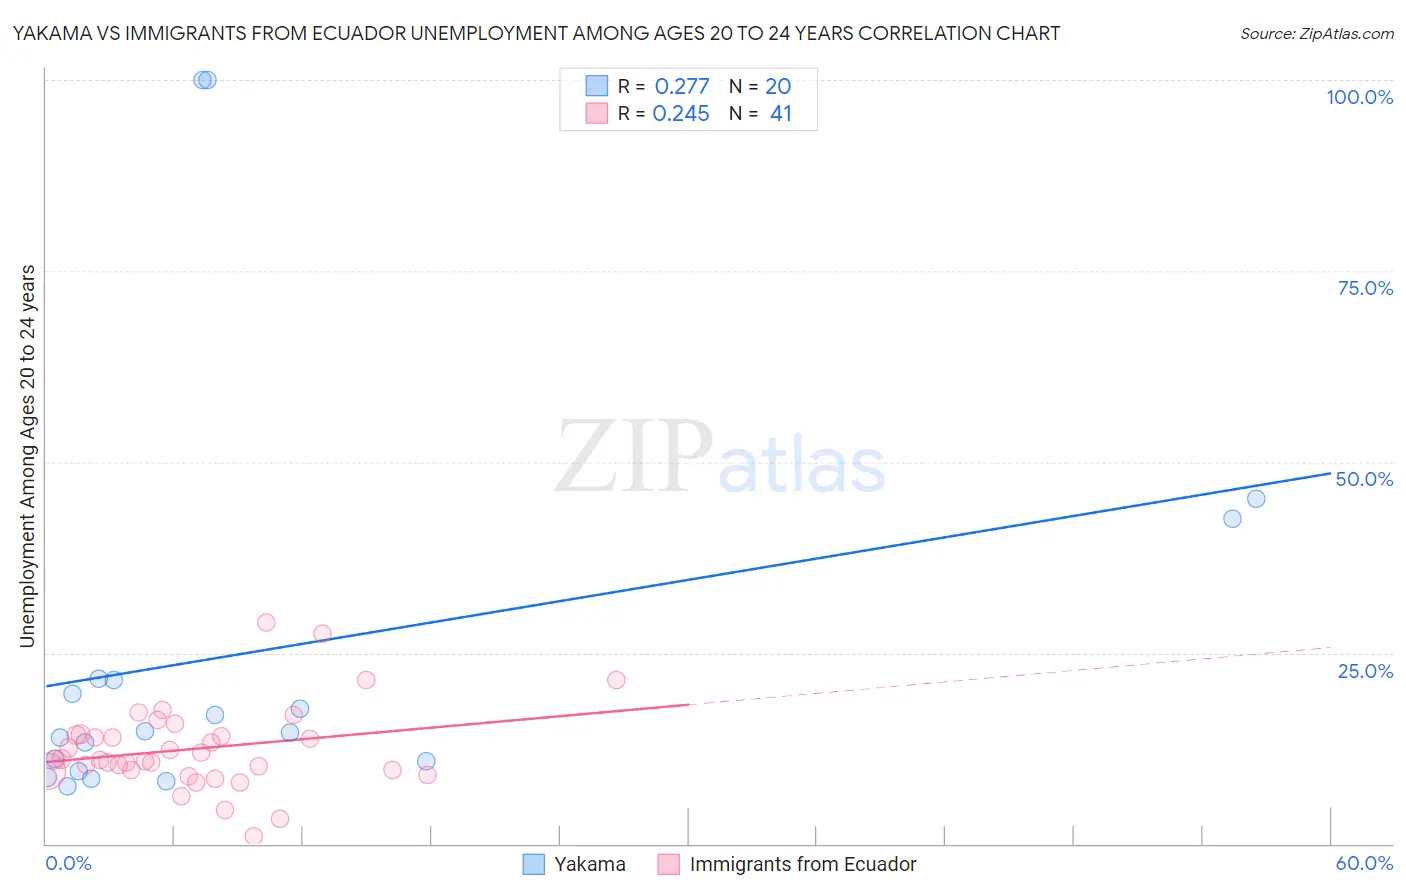
Yakama vs Immigrants from Ecuador Unemployment Among Ages 20 to 24 years Correlation Chart
The statistical analysis conducted on geographies consisting of 19,737,605 people shows a weak positive correlation between the proportion of Yakama and unemployment rate among population between the ages 20 and 24 in the United States with a correlation coefficient (R) of 0.277 and weighted average of 13.1%. Similarly, the statistical analysis conducted on geographies consisting of 266,640,258 people shows a weak positive correlation between the proportion of Immigrants from Ecuador and unemployment rate among population between the ages 20 and 24 in the United States with a correlation coefficient (R) of 0.245 and weighted average of 11.8%, a difference of 11.2%.
Unemployment Among Ages 20 to 24 years Correlation Summary
| Measurement | Yakama | Immigrants from Ecuador |
| Minimum | 7.5% | 1.0% |
| Maximum | 100.0% | 28.9% |
| Range | 92.5% | 27.9% |
| Mean | 25.3% | 12.4% |
| Median | 14.6% | 11.0% |
| Interquartile 25% (IQ1) | 10.2% | 9.6% |
| Interquartile 75% (IQ3) | 21.5% | 14.3% |
| Interquartile Range (IQR) | 11.3% | 4.7% |
| Standard Deviation (Sample) | 27.5% | 5.5% |
| Standard Deviation (Population) | 26.8% | 5.5% |
Similar Demographics by Unemployment Among Ages 20 to 24 years
Demographics Similar to Yakama by Unemployment Among Ages 20 to 24 years
In terms of unemployment among ages 20 to 24 years, the demographic groups most similar to Yakama are Native/Alaskan (13.0%, a difference of 0.48%), Immigrants from Jamaica (13.0%, a difference of 0.86%), Cheyenne (13.0%, a difference of 0.95%), Alaska Native (13.2%, a difference of 0.98%), and Pueblo (13.2%, a difference of 1.2%).
| Demographics | Rating | Rank | Unemployment Among Ages 20 to 24 years |
| Immigrants | Dominica | 0.0 /100 | #316 | Tragic 12.8% |
| Immigrants | Trinidad and Tobago | 0.0 /100 | #317 | Tragic 12.8% |
| Barbadians | 0.0 /100 | #318 | Tragic 12.9% |
| Trinidadians and Tobagonians | 0.0 /100 | #319 | Tragic 12.9% |
| Cheyenne | 0.0 /100 | #320 | Tragic 13.0% |
| Immigrants | Jamaica | 0.0 /100 | #321 | Tragic 13.0% |
| Natives/Alaskans | 0.0 /100 | #322 | Tragic 13.0% |
| Yakama | 0.0 /100 | #323 | Tragic 13.1% |
| Alaska Natives | 0.0 /100 | #324 | Tragic 13.2% |
| Pueblo | 0.0 /100 | #325 | Tragic 13.2% |
| Immigrants | Barbados | 0.0 /100 | #326 | Tragic 13.5% |
| Immigrants | Dominican Republic | 0.0 /100 | #327 | Tragic 13.6% |
| British West Indians | 0.0 /100 | #328 | Tragic 13.7% |
| Dominicans | 0.0 /100 | #329 | Tragic 13.8% |
| Arapaho | 0.0 /100 | #330 | Tragic 13.8% |
Demographics Similar to Immigrants from Ecuador by Unemployment Among Ages 20 to 24 years
In terms of unemployment among ages 20 to 24 years, the demographic groups most similar to Immigrants from Ecuador are U.S. Virgin Islander (11.8%, a difference of 0.050%), Ecuadorian (11.8%, a difference of 0.090%), Soviet Union (11.7%, a difference of 0.21%), Immigrants from Western Africa (11.7%, a difference of 0.25%), and Ghanaian (11.7%, a difference of 0.26%).
| Demographics | Rating | Rank | Unemployment Among Ages 20 to 24 years |
| Alaskan Athabascans | 0.0 /100 | #280 | Tragic 11.6% |
| Armenians | 0.0 /100 | #281 | Tragic 11.7% |
| Immigrants | Cameroon | 0.0 /100 | #282 | Tragic 11.7% |
| Ghanaians | 0.0 /100 | #283 | Tragic 11.7% |
| Immigrants | Western Africa | 0.0 /100 | #284 | Tragic 11.7% |
| Soviet Union | 0.0 /100 | #285 | Tragic 11.7% |
| Ecuadorians | 0.0 /100 | #286 | Tragic 11.8% |
| Immigrants | Ecuador | 0.0 /100 | #287 | Tragic 11.8% |
| U.S. Virgin Islanders | 0.0 /100 | #288 | Tragic 11.8% |
| Belizeans | 0.0 /100 | #289 | Tragic 11.8% |
| Immigrants | Caribbean | 0.0 /100 | #290 | Tragic 11.8% |
| Central American Indians | 0.0 /100 | #291 | Tragic 11.9% |
| Immigrants | Senegal | 0.0 /100 | #292 | Tragic 11.9% |
| Immigrants | Ghana | 0.0 /100 | #293 | Tragic 11.9% |
| Immigrants | Belize | 0.0 /100 | #294 | Tragic 12.0% |