Yakama vs Immigrants from Eastern Asia Unemployment Among Ages 20 to 24 years
COMPARE
Yakama
Immigrants from Eastern Asia
Unemployment Among Ages 20 to 24 years
Unemployment Among Ages 20 to 24 years Comparison
Yakama
Immigrants from Eastern Asia
13.1%
UNEMPLOYMENT AMONG AGES 20 TO 24 YEARS
0.0/ 100
METRIC RATING
323rd/ 347
METRIC RANK
10.3%
UNEMPLOYMENT AMONG AGES 20 TO 24 YEARS
52.7/ 100
METRIC RATING
171st/ 347
METRIC RANK
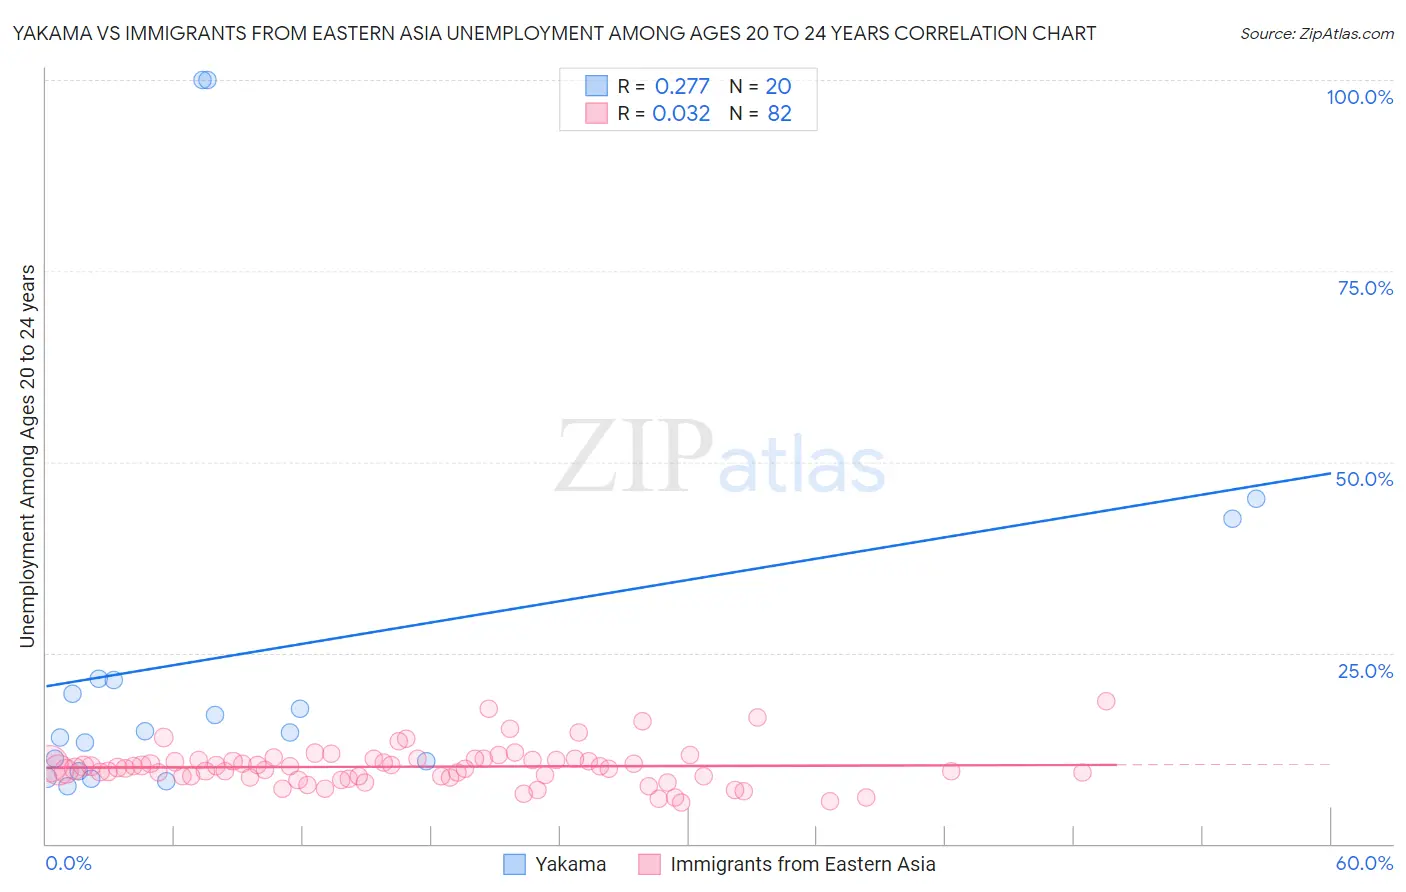
Yakama vs Immigrants from Eastern Asia Unemployment Among Ages 20 to 24 years Correlation Chart
The statistical analysis conducted on geographies consisting of 19,737,605 people shows a weak positive correlation between the proportion of Yakama and unemployment rate among population between the ages 20 and 24 in the United States with a correlation coefficient (R) of 0.277 and weighted average of 13.1%. Similarly, the statistical analysis conducted on geographies consisting of 475,626,632 people shows no correlation between the proportion of Immigrants from Eastern Asia and unemployment rate among population between the ages 20 and 24 in the United States with a correlation coefficient (R) of 0.032 and weighted average of 10.3%, a difference of 27.0%.
Unemployment Among Ages 20 to 24 years Correlation Summary
| Measurement | Yakama | Immigrants from Eastern Asia |
| Minimum | 7.5% | 5.5% |
| Maximum | 100.0% | 18.7% |
| Range | 92.5% | 13.2% |
| Mean | 25.3% | 10.1% |
| Median | 14.6% | 9.9% |
| Interquartile 25% (IQ1) | 10.2% | 8.8% |
| Interquartile 75% (IQ3) | 21.5% | 11.0% |
| Interquartile Range (IQR) | 11.3% | 2.2% |
| Standard Deviation (Sample) | 27.5% | 2.5% |
| Standard Deviation (Population) | 26.8% | 2.5% |
Similar Demographics by Unemployment Among Ages 20 to 24 years
Demographics Similar to Yakama by Unemployment Among Ages 20 to 24 years
In terms of unemployment among ages 20 to 24 years, the demographic groups most similar to Yakama are Native/Alaskan (13.0%, a difference of 0.48%), Immigrants from Jamaica (13.0%, a difference of 0.86%), Cheyenne (13.0%, a difference of 0.95%), Alaska Native (13.2%, a difference of 0.98%), and Pueblo (13.2%, a difference of 1.2%).
| Demographics | Rating | Rank | Unemployment Among Ages 20 to 24 years |
| Immigrants | Dominica | 0.0 /100 | #316 | Tragic 12.8% |
| Immigrants | Trinidad and Tobago | 0.0 /100 | #317 | Tragic 12.8% |
| Barbadians | 0.0 /100 | #318 | Tragic 12.9% |
| Trinidadians and Tobagonians | 0.0 /100 | #319 | Tragic 12.9% |
| Cheyenne | 0.0 /100 | #320 | Tragic 13.0% |
| Immigrants | Jamaica | 0.0 /100 | #321 | Tragic 13.0% |
| Natives/Alaskans | 0.0 /100 | #322 | Tragic 13.0% |
| Yakama | 0.0 /100 | #323 | Tragic 13.1% |
| Alaska Natives | 0.0 /100 | #324 | Tragic 13.2% |
| Pueblo | 0.0 /100 | #325 | Tragic 13.2% |
| Immigrants | Barbados | 0.0 /100 | #326 | Tragic 13.5% |
| Immigrants | Dominican Republic | 0.0 /100 | #327 | Tragic 13.6% |
| British West Indians | 0.0 /100 | #328 | Tragic 13.7% |
| Dominicans | 0.0 /100 | #329 | Tragic 13.8% |
| Arapaho | 0.0 /100 | #330 | Tragic 13.8% |
Demographics Similar to Immigrants from Eastern Asia by Unemployment Among Ages 20 to 24 years
In terms of unemployment among ages 20 to 24 years, the demographic groups most similar to Immigrants from Eastern Asia are Korean (10.3%, a difference of 0.030%), Immigrants from Sweden (10.3%, a difference of 0.070%), Turkish (10.3%, a difference of 0.090%), Ukrainian (10.3%, a difference of 0.10%), and Immigrants from Colombia (10.3%, a difference of 0.13%).
| Demographics | Rating | Rank | Unemployment Among Ages 20 to 24 years |
| Immigrants | Korea | 59.0 /100 | #164 | Average 10.3% |
| Lebanese | 58.3 /100 | #165 | Average 10.3% |
| Italians | 57.7 /100 | #166 | Average 10.3% |
| Immigrants | Fiji | 57.6 /100 | #167 | Average 10.3% |
| Iraqis | 56.7 /100 | #168 | Average 10.3% |
| Immigrants | Colombia | 56.3 /100 | #169 | Average 10.3% |
| Turks | 55.2 /100 | #170 | Average 10.3% |
| Immigrants | Eastern Asia | 52.7 /100 | #171 | Average 10.3% |
| Koreans | 51.9 /100 | #172 | Average 10.3% |
| Immigrants | Sweden | 50.8 /100 | #173 | Average 10.3% |
| Ukrainians | 50.0 /100 | #174 | Average 10.3% |
| Samoans | 45.4 /100 | #175 | Average 10.3% |
| Potawatomi | 42.0 /100 | #176 | Average 10.3% |
| Immigrants | Czechoslovakia | 40.8 /100 | #177 | Average 10.3% |
| Alsatians | 40.5 /100 | #178 | Average 10.3% |