Yakama vs Mongolian In Labor Force | Age 20-64
COMPARE
Yakama
Mongolian
In Labor Force | Age 20-64
In Labor Force | Age 20-64 Comparison
Yakama
Mongolians
75.8%
IN LABOR FORCE | AGE 20-64
0.0/ 100
METRIC RATING
320th/ 347
METRIC RANK
79.9%
IN LABOR FORCE | AGE 20-64
92.0/ 100
METRIC RATING
122nd/ 347
METRIC RANK
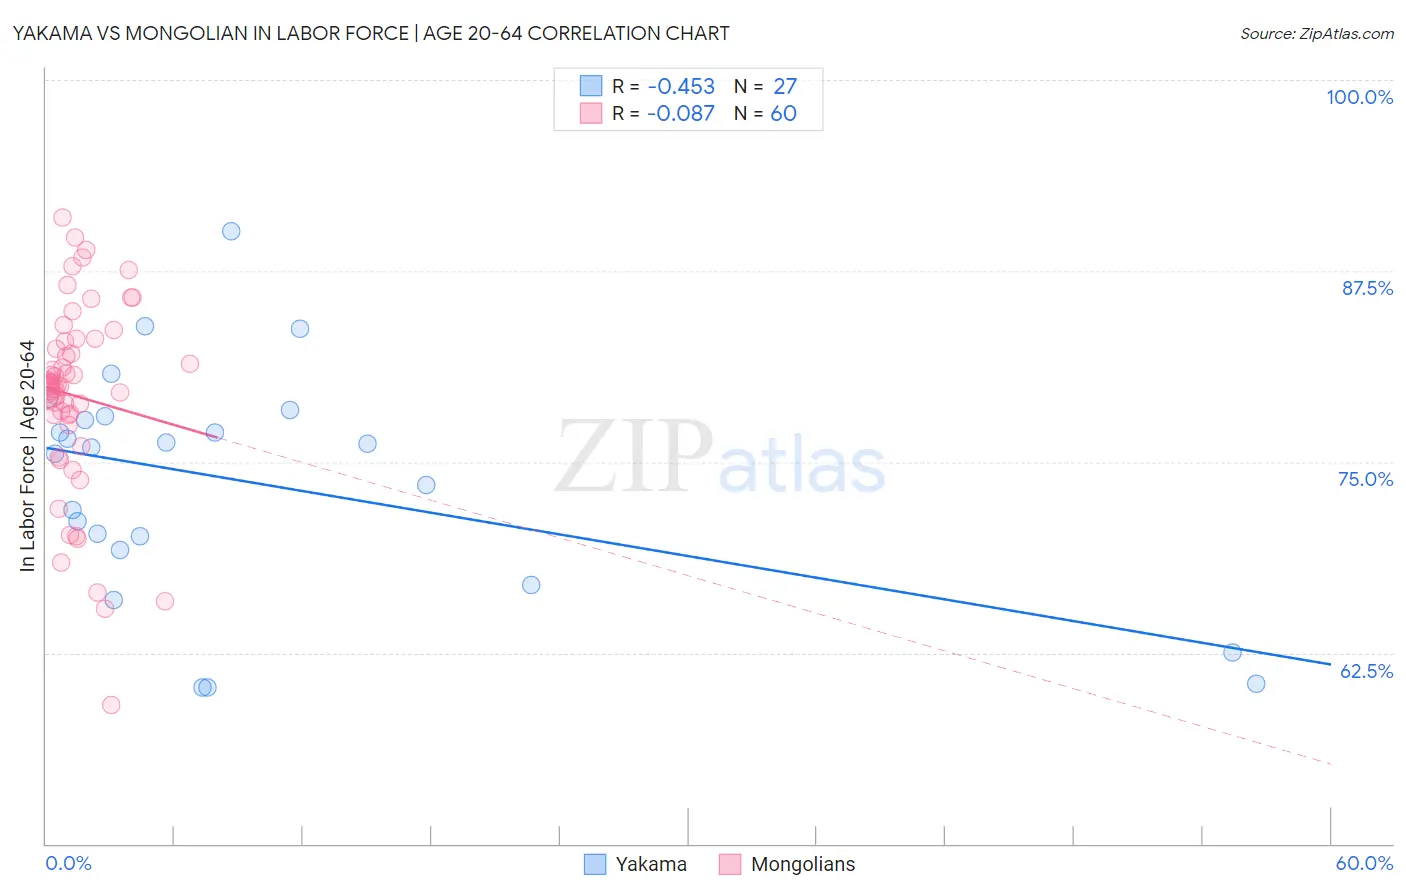
Yakama vs Mongolian In Labor Force | Age 20-64 Correlation Chart
The statistical analysis conducted on geographies consisting of 19,917,879 people shows a moderate negative correlation between the proportion of Yakama and labor force participation rate among population between the ages 20 and 64 in the United States with a correlation coefficient (R) of -0.453 and weighted average of 75.8%. Similarly, the statistical analysis conducted on geographies consisting of 140,359,372 people shows a slight negative correlation between the proportion of Mongolians and labor force participation rate among population between the ages 20 and 64 in the United States with a correlation coefficient (R) of -0.087 and weighted average of 79.9%, a difference of 5.5%.
In Labor Force | Age 20-64 Correlation Summary
| Measurement | Yakama | Mongolian |
| Minimum | 60.2% | 59.1% |
| Maximum | 90.1% | 91.0% |
| Range | 29.9% | 31.9% |
| Mean | 73.6% | 79.3% |
| Median | 75.9% | 80.0% |
| Interquartile 25% (IQ1) | 69.2% | 77.7% |
| Interquartile 75% (IQ3) | 78.0% | 83.0% |
| Interquartile Range (IQR) | 8.8% | 5.3% |
| Standard Deviation (Sample) | 7.6% | 6.4% |
| Standard Deviation (Population) | 7.4% | 6.3% |
Similar Demographics by In Labor Force | Age 20-64
Demographics Similar to Yakama by In Labor Force | Age 20-64
In terms of in labor force | age 20-64, the demographic groups most similar to Yakama are Seminole (75.5%, a difference of 0.35%), Inupiat (76.1%, a difference of 0.38%), Dutch West Indian (75.5%, a difference of 0.40%), Cajun (75.5%, a difference of 0.44%), and Choctaw (75.4%, a difference of 0.50%).
| Demographics | Rating | Rank | In Labor Force | Age 20-64 |
| Shoshone | 0.0 /100 | #313 | Tragic 76.8% |
| Blacks/African Americans | 0.0 /100 | #314 | Tragic 76.8% |
| Ottawa | 0.0 /100 | #315 | Tragic 76.7% |
| Yaqui | 0.0 /100 | #316 | Tragic 76.5% |
| Cherokee | 0.0 /100 | #317 | Tragic 76.2% |
| Chickasaw | 0.0 /100 | #318 | Tragic 76.2% |
| Inupiat | 0.0 /100 | #319 | Tragic 76.1% |
| Yakama | 0.0 /100 | #320 | Tragic 75.8% |
| Seminole | 0.0 /100 | #321 | Tragic 75.5% |
| Dutch West Indians | 0.0 /100 | #322 | Tragic 75.5% |
| Cajuns | 0.0 /100 | #323 | Tragic 75.5% |
| Choctaw | 0.0 /100 | #324 | Tragic 75.4% |
| Menominee | 0.0 /100 | #325 | Tragic 75.3% |
| Creek | 0.0 /100 | #326 | Tragic 75.1% |
| Sioux | 0.0 /100 | #327 | Tragic 75.0% |
Demographics Similar to Mongolians by In Labor Force | Age 20-64
In terms of in labor force | age 20-64, the demographic groups most similar to Mongolians are Immigrants from Taiwan (80.0%, a difference of 0.010%), Maltese (80.0%, a difference of 0.010%), Immigrants from Kuwait (80.0%, a difference of 0.010%), Immigrants from Russia (79.9%, a difference of 0.010%), and Immigrants from Europe (79.9%, a difference of 0.010%).
| Demographics | Rating | Rank | In Labor Force | Age 20-64 |
| Bermudans | 93.3 /100 | #115 | Exceptional 80.0% |
| Immigrants | Western Africa | 93.1 /100 | #116 | Exceptional 80.0% |
| Immigrants | Vietnam | 92.7 /100 | #117 | Exceptional 80.0% |
| Cape Verdeans | 92.7 /100 | #118 | Exceptional 80.0% |
| Immigrants | Taiwan | 92.5 /100 | #119 | Exceptional 80.0% |
| Maltese | 92.4 /100 | #120 | Exceptional 80.0% |
| Immigrants | Kuwait | 92.2 /100 | #121 | Exceptional 80.0% |
| Mongolians | 92.0 /100 | #122 | Exceptional 79.9% |
| Immigrants | Russia | 91.8 /100 | #123 | Exceptional 79.9% |
| Immigrants | Europe | 91.6 /100 | #124 | Exceptional 79.9% |
| Danes | 91.5 /100 | #125 | Exceptional 79.9% |
| Immigrants | France | 90.7 /100 | #126 | Exceptional 79.9% |
| Immigrants | Czechoslovakia | 89.7 /100 | #127 | Excellent 79.9% |
| Immigrants | Eastern Asia | 89.4 /100 | #128 | Excellent 79.9% |
| Italians | 88.9 /100 | #129 | Excellent 79.9% |