White/Caucasian vs Immigrants from Lithuania Unemployment Among Ages 20 to 24 years
COMPARE
White/Caucasian
Immigrants from Lithuania
Unemployment Among Ages 20 to 24 years
Unemployment Among Ages 20 to 24 years Comparison
Whites/Caucasians
Immigrants from Lithuania
10.1%
UNEMPLOYMENT AMONG AGES 20 TO 24 YEARS
87.4/ 100
METRIC RATING
122nd/ 347
METRIC RANK
10.1%
UNEMPLOYMENT AMONG AGES 20 TO 24 YEARS
84.2/ 100
METRIC RATING
130th/ 347
METRIC RANK
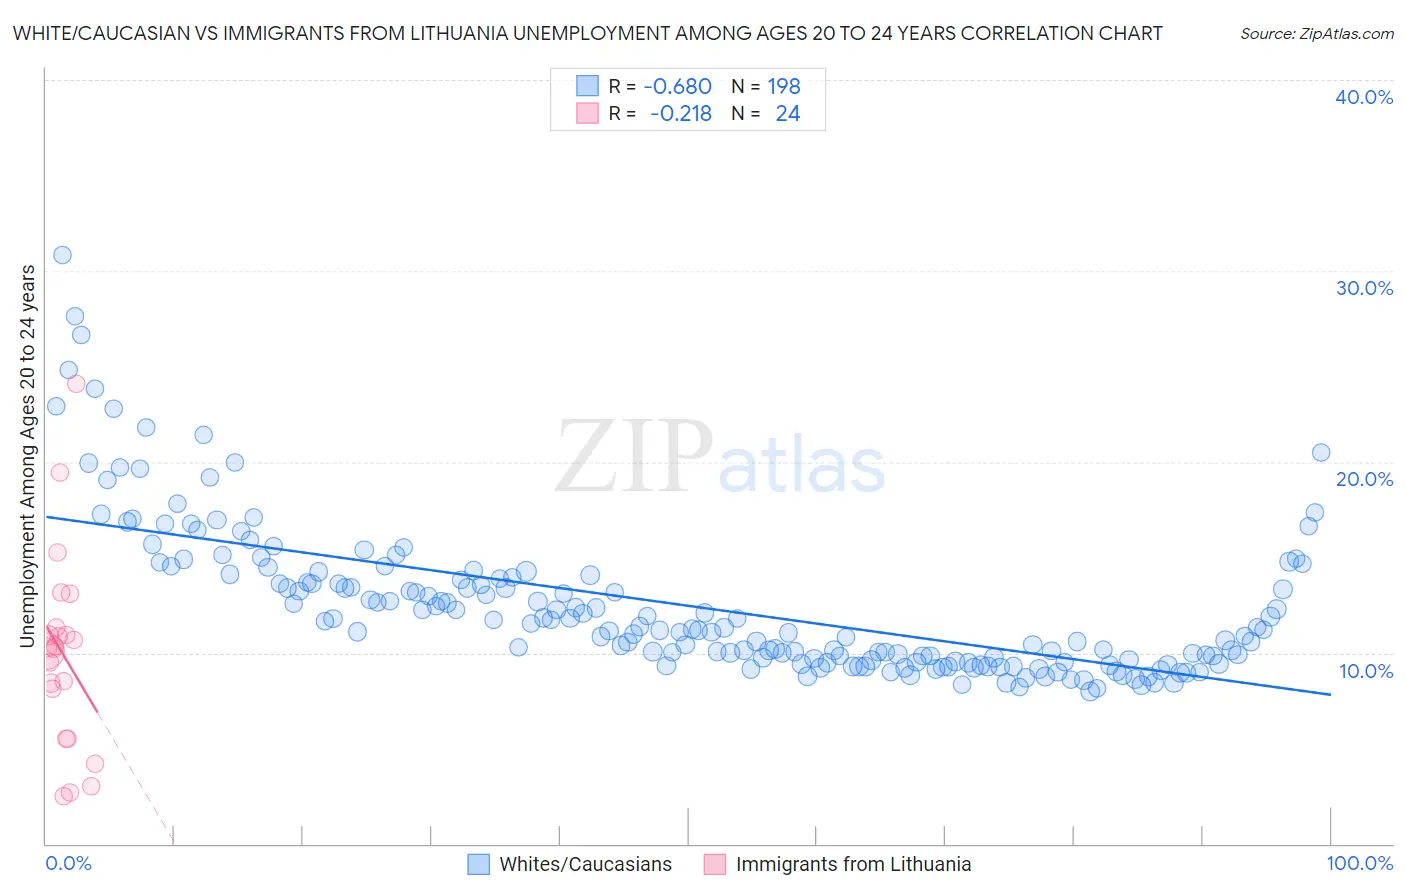
White/Caucasian vs Immigrants from Lithuania Unemployment Among Ages 20 to 24 years Correlation Chart
The statistical analysis conducted on geographies consisting of 530,440,022 people shows a significant negative correlation between the proportion of Whites/Caucasians and unemployment rate among population between the ages 20 and 24 in the United States with a correlation coefficient (R) of -0.680 and weighted average of 10.1%. Similarly, the statistical analysis conducted on geographies consisting of 116,364,728 people shows a weak negative correlation between the proportion of Immigrants from Lithuania and unemployment rate among population between the ages 20 and 24 in the United States with a correlation coefficient (R) of -0.218 and weighted average of 10.1%, a difference of 0.24%.
Unemployment Among Ages 20 to 24 years Correlation Summary
| Measurement | White/Caucasian | Immigrants from Lithuania |
| Minimum | 8.0% | 2.5% |
| Maximum | 30.8% | 24.1% |
| Range | 22.8% | 21.6% |
| Mean | 12.5% | 10.0% |
| Median | 11.3% | 10.3% |
| Interquartile 25% (IQ1) | 9.6% | 6.8% |
| Interquartile 75% (IQ3) | 13.9% | 11.1% |
| Interquartile Range (IQR) | 4.3% | 4.3% |
| Standard Deviation (Sample) | 3.9% | 5.0% |
| Standard Deviation (Population) | 3.9% | 4.9% |
Demographics Similar to Whites/Caucasians and Immigrants from Lithuania by Unemployment Among Ages 20 to 24 years
In terms of unemployment among ages 20 to 24 years, the demographic groups most similar to Whites/Caucasians are Immigrants from Iraq (10.1%, a difference of 0.020%), South African (10.1%, a difference of 0.040%), Immigrants from Canada (10.1%, a difference of 0.070%), Immigrants from Japan (10.1%, a difference of 0.070%), and French (10.1%, a difference of 0.080%). Similarly, the demographic groups most similar to Immigrants from Lithuania are Seminole (10.1%, a difference of 0.0%), Immigrants from South Eastern Asia (10.1%, a difference of 0.010%), Austrian (10.2%, a difference of 0.020%), Immigrants from South Central Asia (10.1%, a difference of 0.030%), and Romanian (10.2%, a difference of 0.030%).
| Demographics | Rating | Rank | Unemployment Among Ages 20 to 24 years |
| Basques | 89.8 /100 | #116 | Excellent 10.1% |
| Immigrants | Uruguay | 89.6 /100 | #117 | Excellent 10.1% |
| Paraguayans | 88.6 /100 | #118 | Excellent 10.1% |
| French | 88.2 /100 | #119 | Excellent 10.1% |
| Immigrants | Canada | 88.2 /100 | #120 | Excellent 10.1% |
| South Africans | 87.8 /100 | #121 | Excellent 10.1% |
| Whites/Caucasians | 87.4 /100 | #122 | Excellent 10.1% |
| Immigrants | Iraq | 87.1 /100 | #123 | Excellent 10.1% |
| Immigrants | Japan | 86.5 /100 | #124 | Excellent 10.1% |
| Spanish | 86.1 /100 | #125 | Excellent 10.1% |
| Jordanians | 86.1 /100 | #126 | Excellent 10.1% |
| Immigrants | Norway | 85.3 /100 | #127 | Excellent 10.1% |
| Immigrants | Brazil | 84.9 /100 | #128 | Excellent 10.1% |
| Immigrants | South Central Asia | 84.6 /100 | #129 | Excellent 10.1% |
| Immigrants | Lithuania | 84.2 /100 | #130 | Excellent 10.1% |
| Seminole | 84.2 /100 | #131 | Excellent 10.1% |
| Immigrants | South Eastern Asia | 84.0 /100 | #132 | Excellent 10.1% |
| Austrians | 83.9 /100 | #133 | Excellent 10.2% |
| Romanians | 83.8 /100 | #134 | Excellent 10.2% |
| Comanche | 83.4 /100 | #135 | Excellent 10.2% |
| Immigrants | Northern Africa | 82.5 /100 | #136 | Excellent 10.2% |