White/Caucasian vs Immigrants from Chile Unemployment Among Ages 20 to 24 years
COMPARE
White/Caucasian
Immigrants from Chile
Unemployment Among Ages 20 to 24 years
Unemployment Among Ages 20 to 24 years Comparison
Whites/Caucasians
Immigrants from Chile
10.1%
UNEMPLOYMENT AMONG AGES 20 TO 24 YEARS
87.4/ 100
METRIC RATING
122nd/ 347
METRIC RANK
10.0%
UNEMPLOYMENT AMONG AGES 20 TO 24 YEARS
94.0/ 100
METRIC RATING
104th/ 347
METRIC RANK
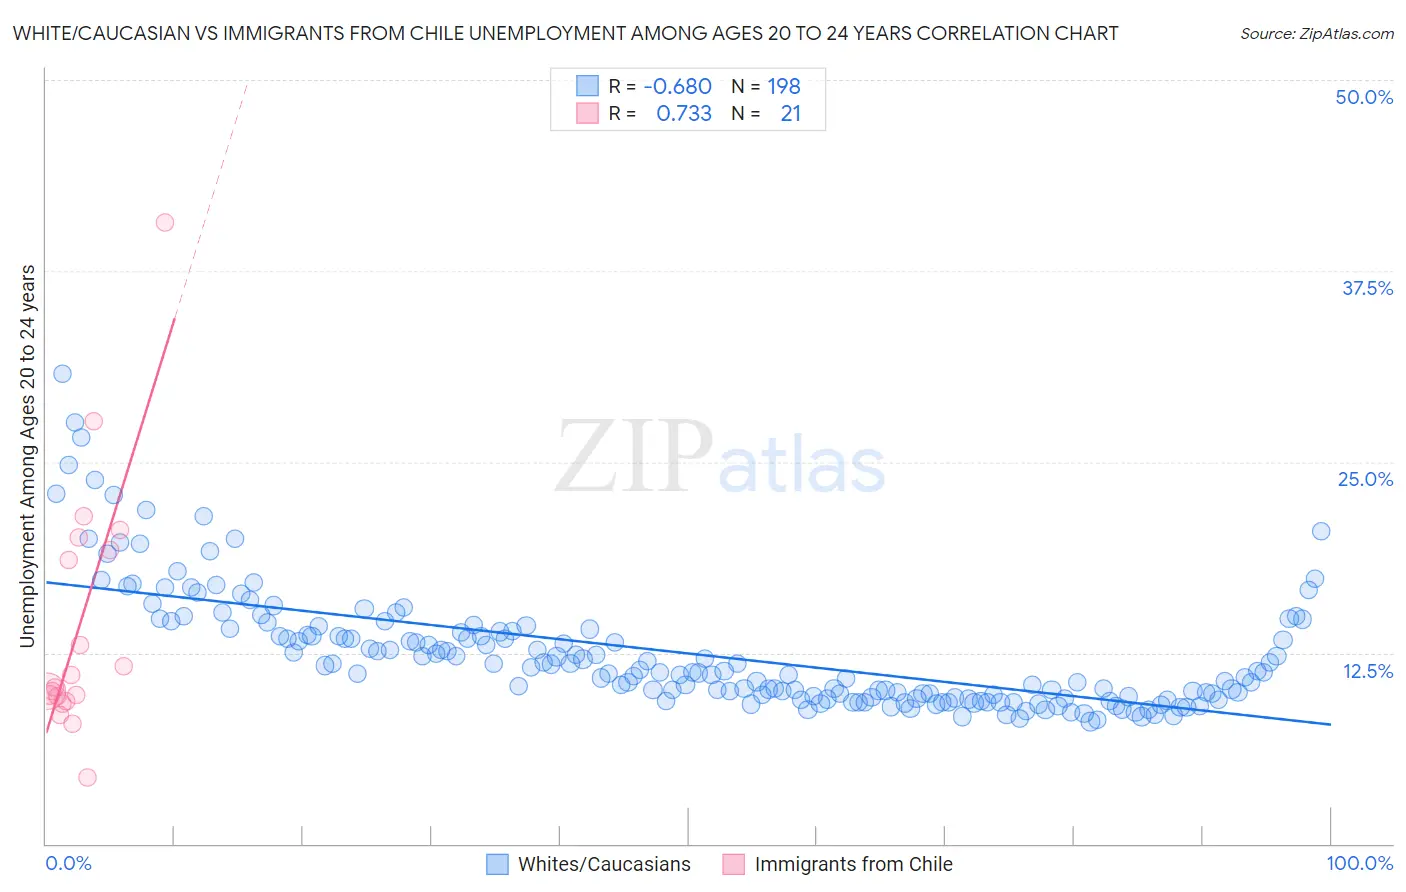
White/Caucasian vs Immigrants from Chile Unemployment Among Ages 20 to 24 years Correlation Chart
The statistical analysis conducted on geographies consisting of 530,440,022 people shows a significant negative correlation between the proportion of Whites/Caucasians and unemployment rate among population between the ages 20 and 24 in the United States with a correlation coefficient (R) of -0.680 and weighted average of 10.1%. Similarly, the statistical analysis conducted on geographies consisting of 216,048,657 people shows a strong positive correlation between the proportion of Immigrants from Chile and unemployment rate among population between the ages 20 and 24 in the United States with a correlation coefficient (R) of 0.733 and weighted average of 10.0%, a difference of 0.78%.
Unemployment Among Ages 20 to 24 years Correlation Summary
| Measurement | White/Caucasian | Immigrants from Chile |
| Minimum | 8.0% | 4.3% |
| Maximum | 30.8% | 40.7% |
| Range | 22.8% | 36.4% |
| Mean | 12.5% | 14.4% |
| Median | 11.3% | 10.3% |
| Interquartile 25% (IQ1) | 9.6% | 9.5% |
| Interquartile 75% (IQ3) | 13.9% | 19.6% |
| Interquartile Range (IQR) | 4.3% | 10.1% |
| Standard Deviation (Sample) | 3.9% | 8.4% |
| Standard Deviation (Population) | 3.9% | 8.2% |
Demographics Similar to Whites/Caucasians and Immigrants from Chile by Unemployment Among Ages 20 to 24 years
In terms of unemployment among ages 20 to 24 years, the demographic groups most similar to Whites/Caucasians are Immigrants from Iraq (10.1%, a difference of 0.020%), South African (10.1%, a difference of 0.040%), Immigrants from Canada (10.1%, a difference of 0.070%), French (10.1%, a difference of 0.080%), and Paraguayan (10.1%, a difference of 0.11%). Similarly, the demographic groups most similar to Immigrants from Chile are Immigrants from Hungary (10.0%, a difference of 0.010%), Pennsylvania German (10.0%, a difference of 0.030%), Irish (10.0%, a difference of 0.040%), Iroquois (10.1%, a difference of 0.10%), and Immigrants from Latvia (10.1%, a difference of 0.13%).
| Demographics | Rating | Rank | Unemployment Among Ages 20 to 24 years |
| Irish | 94.3 /100 | #103 | Exceptional 10.0% |
| Immigrants | Chile | 94.0 /100 | #104 | Exceptional 10.0% |
| Immigrants | Hungary | 94.0 /100 | #105 | Exceptional 10.0% |
| Pennsylvania Germans | 93.9 /100 | #106 | Exceptional 10.0% |
| Iroquois | 93.4 /100 | #107 | Exceptional 10.1% |
| Immigrants | Latvia | 93.2 /100 | #108 | Exceptional 10.1% |
| Filipinos | 93.2 /100 | #109 | Exceptional 10.1% |
| Immigrants | Spain | 93.1 /100 | #110 | Exceptional 10.1% |
| Immigrants | Indonesia | 92.7 /100 | #111 | Exceptional 10.1% |
| Northern Europeans | 92.7 /100 | #112 | Exceptional 10.1% |
| German Russians | 92.4 /100 | #113 | Exceptional 10.1% |
| Ottawa | 90.8 /100 | #114 | Exceptional 10.1% |
| Immigrants | Morocco | 90.5 /100 | #115 | Exceptional 10.1% |
| Basques | 89.8 /100 | #116 | Excellent 10.1% |
| Immigrants | Uruguay | 89.6 /100 | #117 | Excellent 10.1% |
| Paraguayans | 88.6 /100 | #118 | Excellent 10.1% |
| French | 88.2 /100 | #119 | Excellent 10.1% |
| Immigrants | Canada | 88.2 /100 | #120 | Excellent 10.1% |
| South Africans | 87.8 /100 | #121 | Excellent 10.1% |
| Whites/Caucasians | 87.4 /100 | #122 | Excellent 10.1% |
| Immigrants | Iraq | 87.1 /100 | #123 | Excellent 10.1% |