White/Caucasian vs Central American Indian Unemployment Among Ages 20 to 24 years
COMPARE
White/Caucasian
Central American Indian
Unemployment Among Ages 20 to 24 years
Unemployment Among Ages 20 to 24 years Comparison
Whites/Caucasians
Central American Indians
10.1%
UNEMPLOYMENT AMONG AGES 20 TO 24 YEARS
87.4/ 100
METRIC RATING
122nd/ 347
METRIC RANK
11.9%
UNEMPLOYMENT AMONG AGES 20 TO 24 YEARS
0.0/ 100
METRIC RATING
291st/ 347
METRIC RANK
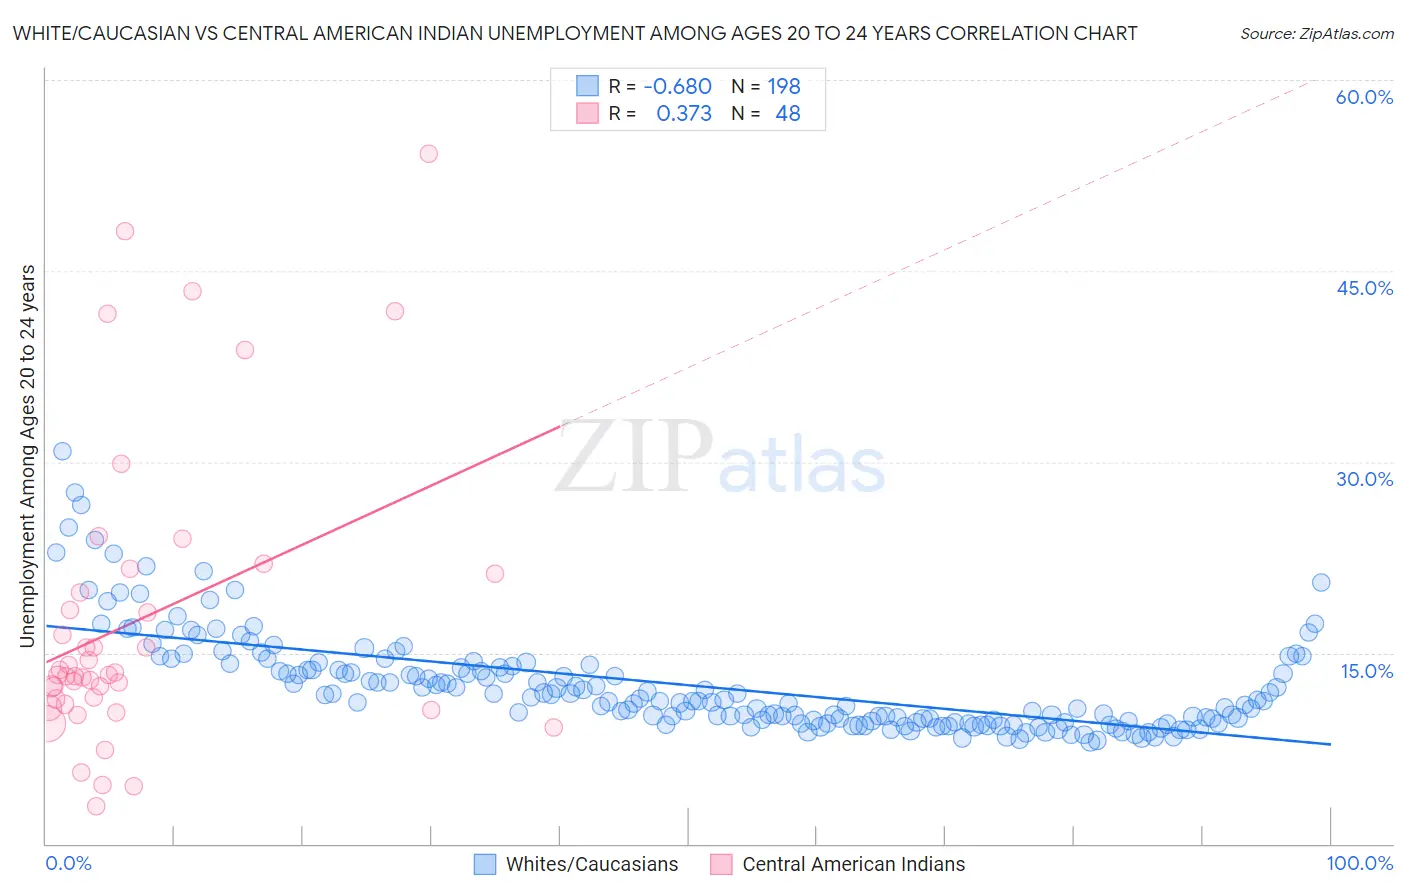
White/Caucasian vs Central American Indian Unemployment Among Ages 20 to 24 years Correlation Chart
The statistical analysis conducted on geographies consisting of 530,440,022 people shows a significant negative correlation between the proportion of Whites/Caucasians and unemployment rate among population between the ages 20 and 24 in the United States with a correlation coefficient (R) of -0.680 and weighted average of 10.1%. Similarly, the statistical analysis conducted on geographies consisting of 320,123,925 people shows a mild positive correlation between the proportion of Central American Indians and unemployment rate among population between the ages 20 and 24 in the United States with a correlation coefficient (R) of 0.373 and weighted average of 11.9%, a difference of 17.7%.
Unemployment Among Ages 20 to 24 years Correlation Summary
| Measurement | White/Caucasian | Central American Indian |
| Minimum | 8.0% | 2.9% |
| Maximum | 30.8% | 54.2% |
| Range | 22.8% | 51.3% |
| Mean | 12.5% | 17.6% |
| Median | 11.3% | 13.3% |
| Interquartile 25% (IQ1) | 9.6% | 11.2% |
| Interquartile 75% (IQ3) | 13.9% | 20.5% |
| Interquartile Range (IQR) | 4.3% | 9.3% |
| Standard Deviation (Sample) | 3.9% | 11.7% |
| Standard Deviation (Population) | 3.9% | 11.6% |
Similar Demographics by Unemployment Among Ages 20 to 24 years
Demographics Similar to Whites/Caucasians by Unemployment Among Ages 20 to 24 years
In terms of unemployment among ages 20 to 24 years, the demographic groups most similar to Whites/Caucasians are Immigrants from Iraq (10.1%, a difference of 0.020%), South African (10.1%, a difference of 0.040%), Immigrants from Canada (10.1%, a difference of 0.070%), Immigrants from Japan (10.1%, a difference of 0.070%), and French (10.1%, a difference of 0.080%).
| Demographics | Rating | Rank | Unemployment Among Ages 20 to 24 years |
| Immigrants | Morocco | 90.5 /100 | #115 | Exceptional 10.1% |
| Basques | 89.8 /100 | #116 | Excellent 10.1% |
| Immigrants | Uruguay | 89.6 /100 | #117 | Excellent 10.1% |
| Paraguayans | 88.6 /100 | #118 | Excellent 10.1% |
| French | 88.2 /100 | #119 | Excellent 10.1% |
| Immigrants | Canada | 88.2 /100 | #120 | Excellent 10.1% |
| South Africans | 87.8 /100 | #121 | Excellent 10.1% |
| Whites/Caucasians | 87.4 /100 | #122 | Excellent 10.1% |
| Immigrants | Iraq | 87.1 /100 | #123 | Excellent 10.1% |
| Immigrants | Japan | 86.5 /100 | #124 | Excellent 10.1% |
| Spanish | 86.1 /100 | #125 | Excellent 10.1% |
| Jordanians | 86.1 /100 | #126 | Excellent 10.1% |
| Immigrants | Norway | 85.3 /100 | #127 | Excellent 10.1% |
| Immigrants | Brazil | 84.9 /100 | #128 | Excellent 10.1% |
| Immigrants | South Central Asia | 84.6 /100 | #129 | Excellent 10.1% |
Demographics Similar to Central American Indians by Unemployment Among Ages 20 to 24 years
In terms of unemployment among ages 20 to 24 years, the demographic groups most similar to Central American Indians are Immigrants from Senegal (11.9%, a difference of 0.080%), Immigrants from Ghana (11.9%, a difference of 0.31%), Immigrants from Belize (12.0%, a difference of 0.34%), Immigrants from Armenia (12.0%, a difference of 0.52%), and Cajun (12.0%, a difference of 0.55%).
| Demographics | Rating | Rank | Unemployment Among Ages 20 to 24 years |
| Immigrants | Western Africa | 0.0 /100 | #284 | Tragic 11.7% |
| Soviet Union | 0.0 /100 | #285 | Tragic 11.7% |
| Ecuadorians | 0.0 /100 | #286 | Tragic 11.8% |
| Immigrants | Ecuador | 0.0 /100 | #287 | Tragic 11.8% |
| U.S. Virgin Islanders | 0.0 /100 | #288 | Tragic 11.8% |
| Belizeans | 0.0 /100 | #289 | Tragic 11.8% |
| Immigrants | Caribbean | 0.0 /100 | #290 | Tragic 11.8% |
| Central American Indians | 0.0 /100 | #291 | Tragic 11.9% |
| Immigrants | Senegal | 0.0 /100 | #292 | Tragic 11.9% |
| Immigrants | Ghana | 0.0 /100 | #293 | Tragic 11.9% |
| Immigrants | Belize | 0.0 /100 | #294 | Tragic 12.0% |
| Immigrants | Armenia | 0.0 /100 | #295 | Tragic 12.0% |
| Cajuns | 0.0 /100 | #296 | Tragic 12.0% |
| Blackfeet | 0.0 /100 | #297 | Tragic 12.0% |
| Lumbee | 0.0 /100 | #298 | Tragic 12.0% |