Immigrants from Russia vs Immigrants from Belarus Unemployment
COMPARE
Immigrants from Russia
Immigrants from Belarus
Unemployment
Unemployment Comparison
Immigrants from Russia
Immigrants from Belarus
5.2%
UNEMPLOYMENT
66.6/ 100
METRIC RATING
159th/ 347
METRIC RANK
5.3%
UNEMPLOYMENT
35.6/ 100
METRIC RATING
189th/ 347
METRIC RANK
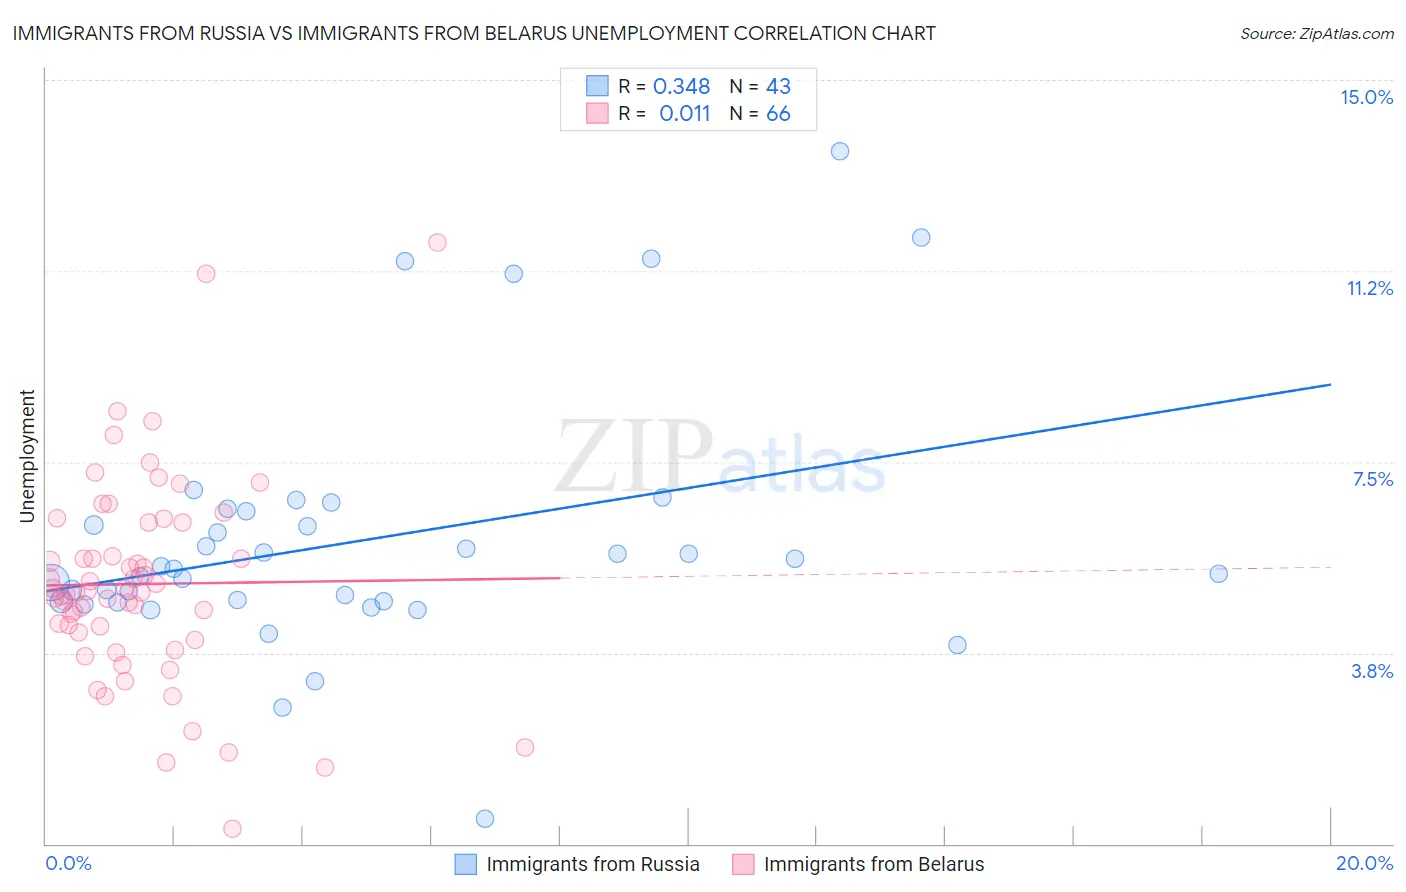
Immigrants from Russia vs Immigrants from Belarus Unemployment Correlation Chart
The statistical analysis conducted on geographies consisting of 347,647,177 people shows a mild positive correlation between the proportion of Immigrants from Russia and unemployment in the United States with a correlation coefficient (R) of 0.348 and weighted average of 5.2%. Similarly, the statistical analysis conducted on geographies consisting of 150,154,457 people shows no correlation between the proportion of Immigrants from Belarus and unemployment in the United States with a correlation coefficient (R) of 0.011 and weighted average of 5.3%, a difference of 2.0%.
Unemployment Correlation Summary
| Measurement | Immigrants from Russia | Immigrants from Belarus |
| Minimum | 0.50% | 0.30% |
| Maximum | 13.6% | 11.8% |
| Range | 13.1% | 11.5% |
| Mean | 6.0% | 5.1% |
| Median | 5.4% | 4.9% |
| Interquartile 25% (IQ1) | 4.8% | 4.2% |
| Interquartile 75% (IQ3) | 6.5% | 6.3% |
| Interquartile Range (IQR) | 1.8% | 2.1% |
| Standard Deviation (Sample) | 2.5% | 2.0% |
| Standard Deviation (Population) | 2.5% | 2.0% |
Similar Demographics by Unemployment
Demographics Similar to Immigrants from Russia by Unemployment
In terms of unemployment, the demographic groups most similar to Immigrants from Russia are Immigrants from Egypt (5.2%, a difference of 0.0%), Laotian (5.2%, a difference of 0.020%), Immigrants from Oceania (5.2%, a difference of 0.10%), Spanish (5.2%, a difference of 0.11%), and Immigrants from Zaire (5.2%, a difference of 0.13%).
| Demographics | Rating | Rank | Unemployment |
| Immigrants | Hong Kong | 75.2 /100 | #152 | Good 5.2% |
| Egyptians | 75.2 /100 | #153 | Good 5.2% |
| Immigrants | China | 74.7 /100 | #154 | Good 5.2% |
| Immigrants | Northern Africa | 71.3 /100 | #155 | Good 5.2% |
| Immigrants | Kazakhstan | 70.4 /100 | #156 | Good 5.2% |
| Sri Lankans | 69.5 /100 | #157 | Good 5.2% |
| Immigrants | Egypt | 66.7 /100 | #158 | Good 5.2% |
| Immigrants | Russia | 66.6 /100 | #159 | Good 5.2% |
| Laotians | 66.3 /100 | #160 | Good 5.2% |
| Immigrants | Oceania | 65.2 /100 | #161 | Good 5.2% |
| Spanish | 65.1 /100 | #162 | Good 5.2% |
| Immigrants | Zaire | 64.7 /100 | #163 | Good 5.2% |
| Immigrants | Colombia | 64.7 /100 | #164 | Good 5.2% |
| Immigrants | Brazil | 63.1 /100 | #165 | Good 5.2% |
| Immigrants | Indonesia | 61.2 /100 | #166 | Good 5.2% |
Demographics Similar to Immigrants from Belarus by Unemployment
In terms of unemployment, the demographic groups most similar to Immigrants from Belarus are Arab (5.3%, a difference of 0.020%), Alsatian (5.3%, a difference of 0.090%), Somali (5.3%, a difference of 0.11%), South American (5.3%, a difference of 0.11%), and Costa Rican (5.3%, a difference of 0.12%).
| Demographics | Rating | Rank | Unemployment |
| Spaniards | 42.2 /100 | #182 | Average 5.3% |
| Brazilians | 40.2 /100 | #183 | Average 5.3% |
| Assyrians/Chaldeans/Syriacs | 39.2 /100 | #184 | Fair 5.3% |
| Immigrants | Thailand | 38.9 /100 | #185 | Fair 5.3% |
| Immigrants | Uganda | 37.8 /100 | #186 | Fair 5.3% |
| Costa Ricans | 37.4 /100 | #187 | Fair 5.3% |
| Alsatians | 37.0 /100 | #188 | Fair 5.3% |
| Immigrants | Belarus | 35.6 /100 | #189 | Fair 5.3% |
| Arabs | 35.3 /100 | #190 | Fair 5.3% |
| Somalis | 34.0 /100 | #191 | Fair 5.3% |
| South Americans | 33.9 /100 | #192 | Fair 5.3% |
| Immigrants | Somalia | 33.8 /100 | #193 | Fair 5.3% |
| Immigrants | Laos | 30.9 /100 | #194 | Fair 5.3% |
| Immigrants | Southern Europe | 30.9 /100 | #195 | Fair 5.3% |
| Peruvians | 29.9 /100 | #196 | Fair 5.3% |